

Modern pharmaceutical analysis relies on a range of instrumental techniques to ensure drug safety, efficacy, and regulatory compliance. Among these, UV-Visible (UV-Vis) spectrophotometry is universal in pharma R&D and QC labs. This method measures how much ultraviolet or visible light a sample absorbs, and through the Beer–Lambert law (absorbance ∝ concentration), it enables quantitation of drug compounds.

The strong demand for rapid, reliable analysis is reflected in market trends: the global spectrophotometer market is growing ~5.8% annually (projected from ~$2.8 B in 2024 to ~$4.2 B by 2032) driven largely by pharmaceutical and biotech R&D. Notably, the Asia–Pacific (including India) region shows the highest growth rates, with heavy investment in healthcare R&D. In this context, UV-Vis spectroscopy plays a critical role in routine QC, helping verify that ingredients and products meet pharmacopeial standards and release criteria.
1. What is UV-Visible Spectrophotometry?
UV-Vis spectrophotometry is an absorption spectroscopy technique that measures how much light a sample absorbs at specific wavelengths. Typically, it covers the ultraviolet range (~190–400 nm) and the visible range (~400–700 nm), where many organic drug molecules have characteristic absorbance (chromophores). In practice, an instrument directs light through a solution of the drug; a detector measures the intensity of light before (I₀) and after (I) the sample.
According to the Beer–Lambert law, absorbance (A) is related to concentration (c) by A = ε·c·l (ε = molar absorptivity, l = path length). Thus, UV-Vis is inherently quantitative: a calibration curve of absorbance vs. concentration allows direct determination of unknown sample concentrations. There are two main optical configurations: single-beam and double-beam spectrophotometers. In a single-beam instrument, all light from the source passes sequentially through the sample; a separate “blank” measurement is first recorded (to zero the baseline), then replaced by the sample. Single-beam designs are simple, compact, and cost-effective, and have high optical throughput, but they can suffer from baseline drift if the lamp intensity fluctuates.
In contrast, a double-beam instrument splits the light into two paths – one through the sample and one through a reference (blank) – and measures them simultaneously. This built-in referencing automatically corrects for lamp fluctuations and electrical noise, yielding more stable, reproducible readings. (Most modern QC labs use double-beam instruments for higher precision.)
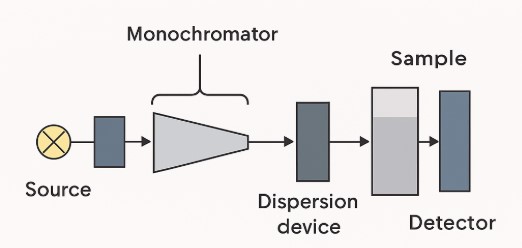
Common components of a UV-Vis spectrophotometer include a light source (typically a deuterium lamp for UV and a tungsten/halogen lamp for visible light), a wavelength selector (monochromator, e.g., grating or prism), a sample holder (cuvette), a photodetector, and a readout/display. Light from the source enters the monochromator, which isolates a narrow band of wavelengths (often by diffracting the light off a rotating grating).
The selected light beam then passes through the sample cuvette; the detector measures the transmitted intensity. A microprocessor calculates absorbance from I₀ and I. Figure 1 (below) shows a simplified single-beam block diagram of these components. In effect, UV-Vis spectrophotometers convert an optical measurement into a digital absorbance spectrum (absorbance vs. wavelength) or a single-wavelength absorbance value at the drug’s λ_max.
2. Why is UV-Vis Spectrophotometry Used in Pharmaceuticals?
UV-Vis spectroscopy offers several key advantages that make it ideal for routine pharmaceutical analysis:
Non-destructive: The measurement does not consume the sample or destroy it, so the same sample solution can be used for other tests or manufacturing after analysis. This is especially valuable when sample is limited or expensive. Rapid and simple: UV-Vis assays are very fast – typically only a few minutes of run time per sample – and usually require minimal sample preparation (often just dilution in a suitable solvent). Many modern spectrophotometers are “plug-and-play” and user-friendly, requiring little training.
Cost-effective: After the initial instrument purchase, running costs are low (no expensive columns or reagents are needed). Solvents and samples are often reused, making per-test costs very low.
Highly quantitative: UV-Vis provides accurate concentration measurements for chromophoric compounds. Its linear response (Beer’s law) yields reliable assay and potency results. For example, one study noted that a UV-Vis method gave intra- and inter-day RSDs <1% and recoveries ≈100% when assaying an antiviral drug.
Qualitative/ID capability: The technique also provides qualitative information (spectral “fingerprints”). Comparing a sample’s spectrum to a reference can confirm compound identity or purity. Many organic drug molecules have unique absorbance peaks, which help verify their identity and detect UV-absorbing impurities.
Regulatory compliance: UV-Vis is a pharmacopeial-friendly method. Major pharmacopeias (USP, EP, IP) include UV-Vis assay methods for dozens of drugs, and even an instrument qualification chapter (e.g., USP <857>) specifically for UV-Vis systems.
Because of these advantages, UV-Vis spectroscopy is an important tool in drug development and manufacturing. It is routinely used in drug development labs (to track reaction conversion and stability) and in QC/QA labs (for batch release testing). Indeed, instrument vendors and lab guides note that UV-Vis is one of the most commonly used techniques in pharmaceutical QA/QC, allowing fast measurement of drug concentrations in solutions, tablets, capsules, or biological fluids.
3. Applications in the Pharmaceutical Industry
UV-Vis spectrophotometry has diverse applications in pharmaceuticals. Key use cases include:
3.1 Drug Assay and Content Uniformity
UV-Vis is widely used to assay (quantify) the active pharmaceutical ingredient (API) in a dosage form. A solution of a tablet or capsule is prepared, and its absorbance measured at the drug’s λ_max. Using a calibration curve, the API concentration – and thus the content per tablet – can be determined. This is essential for confirming dosage accuracy.
For content uniformity (checking that each tablet in a batch has uniform drug content), individual tablets can be dissolved and assayed by UV-Vis. For example, Shah et al. developed a UV-Vis method (two-wavelength simultaneous equations at 226.4 and 254.0 nm) to determine atenolol and losartan in combined tablets. The method was validated and shown to be simple, rapid, and accurate, confirming that all tested tablets met the 85–115% content uniformity criteria.
3.2 Dissolution Testing
Dissolution testing measures how quickly and completely a drug is released from a solid dosage form (tablet/capsule) in a liquid medium. UV-Vis spectroscopy is often used to analyze dissolution samples: at specified time points, aliquots of the dissolution medium are withdrawn, filtered, and the absorbance of the solution is measured. This quantifies how much API has dissolved. In practice, most pharmacopoeial dissolution methods are UV-Vis based for drugs with a UV chromophore. (Computerized UV-Vis detectors can even be integrated with dissolution machines for real-time monitoring.). The resulting dissolution profiles help ensure consistent batch quality and bioavailability.
3.3 Stability and Degradation Studies
UV-Vis spectroscopy is invaluable in stability testing. During forced degradation or real-time stability studies, changes in the drug’s absorbance spectrum or peak intensity can indicate chemical degradation. For instance, a decrease in the API’s absorbance peak over time shows potency loss, while the appearance of new peaks may indicate the formation of degradants. Pharmaguddu.com notes that UV-Vis offers a “fast, economical and accurate” way to track stability markers at all stages of development.
Spectral scans can reveal shifts or additional peaks from products of photodegradation, hydrolysis, or oxidation. Because many degradation products also absorb UV light, UV-Vis allows simple monitoring of purity without needing advanced separation. In short, UV-Vis provides a straightforward assay of “potency and impurities” during accelerated aging, helping predict shelf life.
3.4 Impurity Profiling
Compounds with UV-active chromophores (e.g., many organic impurities) can be detected and quantitated by UV-Vis. In practice, impurity profiling is often done using HPLC-UV (separation followed by UV detection), but UV-Vis can also be used in simpler assays. For example, if a known impurity has a distinct λ_max, its concentration in a sample can be estimated. Even without separation, comparing spectral shapes can flag the presence of extra peaks. As one vendor notes, UV spectrophotometry can “provide valuable information about… impurities” by measuring UV absorption. (However, note that very low-level impurities or those lacking UV chromophores may require more sensitive techniques like mass spectrometry.)
3.5 Colorimetric Assays
When an analyte does not absorb strongly in the UV/Vis range, a colorimetric reagent is often used to form a colored complex. In such assays, a chemical reaction produces a visible dye whose intensity correlates with analyte concentration. UV-Vis spectrophotometers then measure the color absorbance (usually in the visible spectrum, 400–700 nm). Classic examples include iron(III)-based complexes or azo dyes formed with reagents like ferric chloride or bromophenol blue.
Many pharmacopeial tests (e.g., assay of certain vitamins or inorganic compounds) use this approach. The advantage is that UV-Vis still provides a direct readout of concentration via absorbance of the colored product. Notably, color analysis is also used for visual quality control – for example, ensuring uniform tablet or capsule color, since color intensity (hue) can be measured precisely by UV-Vis.
4. Instrumentation and Working Principle
A UV-Vis spectrophotometer is composed of a light source, a sample compartment, a detector, light reading, and a monochromator. In the light source block, there are two types of lamps: a tungsten or halogen lamp that emits visible spectrum light, and a deuterium which emits UV light. These types of lamps emit broad-band light that is collected by the monochromator, which consists of slits, mirrors, a prism, and a diffraction grating. The monochromator also selects a narrow band of light.
The monochromatic beam is then focused towards the sample cuvette. In the sample compartment, a beam of light passes through the liquid sample. A photodetector unit, such as a photodiode or photomultiplier tube measures the quantity of transmitted light consisting of I and compares it to a reference intensity I₀. For a single-beam setup, (I₀) can be determined by first running blank experiments. In a double-beam design, a beam-splitter directs one beam through the sample while another beam goes through a reference cuvette, enabling ratio measurements in real time. The instrument’s electronics compute absorbance (A = log[I₀/I]) and send the data to a display or computer for analysis. In practice, modern UV-Vis systems often integrate automated wavelength scanning to generate entire absorbance spectra, as well as fixed-wavelength modes for fast quantification.
Measurement Flow
Lamp → Monochromator: Polychromatic light is incident on the entrance slit of the monochromator and is collimated onto a diffraction grating. The grating (with mirrors) is rotated to a specific position to select a predetermined wavelength, which is focused out of the exit slit.
Monochromatic Light → Sample: The beam of light passes through the sample cell. Molecules in the sample absorb light at specific wavelengths, thereby diminishing the intensity of the beam.
Detection: The photodetector records the intensity (I) that is transmitted. In a double-beam instrument, a reference beam that does not pass through the sample is measured simultaneously, allowing for correction of source fluctuations.
Data Output: The absorbance (A) is computed and displayed by the spectrophotometer software. A calibration curve can be created to relate concentration to absorbance. For qualitative analysis and purity checks, absorption spectra (plots of A vs. wavelength) are generated.
Thus, a UV-Vis spectrometer transforms light attenuation measurements into quantitative analyses. Many instruments have automated baselines and advanced features, including editing, data smoothing, and storage, which enhance the precision of the measured results.
5. Regulatory and Validation Aspects
Pharmaceutical UV-Vis methods are subject to strict compliance requirements. Regulatory Bodies such as Pharmacopeias have set rules on instrument verification and method validation. For instance, EP 2.2.25 and “Ultraviolet-Visible Spectrophotometry” of USP Chapter <857> issued previously have defined tests for measurement systems and QC procedures. As of late 2019, the revised <857> has also prescribed routine instrument checks (wavelength accuracy, stray light, and noise) to confirm intended function suitability. Similarly, Agilent Application Notes place importance on compliance with USP/EP guidance for UV-Vis usage within GMP laboratories.
Analytical techniques (for example, UV-Vis assays) are validated according to international standards (ICH Q2(R1)) prior to their application. Validation shows specificity (no interference from excipients), linearity (absorbance ∝ concentration across the intended range), accuracy (recovery of a known amount of drug ~100%), precision (repeatability/intermediate precision with RSD ≤2% for precision), range, detection/quantitation limits, and robustness.
In practice, UV-Vis assays demonstrate good linearity (r²≥0.999) and accuracy. For example, a stability-indicating UV method for rifaximin was published and validated according to ICH Q2(R1). It demonstrated intra- and inter-day precision (RSD) <1% along with labeled recovery. Accuracy is confirmed through recovery studies (e.g., spiking a placebo with API) and through comparison with other established reference methods. All these parameters need to be documented for method submission according to FDA and other regulators.
In addition to that, a number of monographs and regulatory compendia list UV-Vis assay methods for drug identity and content as official procedures. These methods are bound to the regulations specified in USP <857>, ICH Q2, and any local pharmacopeia, such as the Indian one. Ultimately, the estimated acceptance of a method based on UV-Vis techniques cannot be applied unless the method undergoes thorough validation, including system suitability tests and compliance with all applicable pharmacopeial/ICH standards.
6. Advantages of UV-Visible Spectrophotometry
- The system has few moving parts, so user operation is easy and routine upkeep is low.
- Rapid measurement of each sample, often taking less than one minute, enables high throughput. Complete spectral scans are performed in only seconds.
- Unlike HPLCs, there are no expensive disposables, mobile phases, or column cartridges required. While cuvettes and solvents are inexpensive, now the per sample cost is very low.
- Analysis allows reuse or further tests on samples, meaning they remain intact post-analysis.
- Numerous drugs with strong UV absorption provide great sensitivity with a detection limit of 10 to the power of negative 5 M. Excellent linear response ensures precise quantitation.
- Use often requires only dissolution or dilution. No complex derivatization is needed except for colorimetric assays. These characteristics make UV-Vis ideal for routine quality control and stability testing laboratories. It provides fast, accurate assays for complicated drugs without elaborate procedures. Often, results are ready in real time, at the push of a button. This accelerates decision-making in manufacturing.
7. Limitations of UV-Vis Spectrophotometry
Chromophores: For UV-Vis to work, a compound must have UV/visible absorbing regions: drugs not possessing conjugated double bonds or aromatic rings may be UV ‘invisible’. Non-chromophoric substances need color derivatization (color reagents) or other methods like HPLC or GC-MS.
Interferences: Other UV-absorbing species (excipients, impurities, solvent) may interfere. For instance, some tablet fillers and certain dyes or preservatives absorb UV light. Careful blanking and specificity checks are necessary. Also, particulate matter or emulsions that scatter light distort readings. As such, samples must be clear and properly filtered.
Sensitivity Limits: These are adequate for assay ranges, but UV-Vis is less sensitive than HPLC-MS. Ultra-sensitive detection of dilute samples, for example, trace-level impurity analysis, may exceed its detection thresholds. Typical detection with UV-Vis is less than chem HPLC or MS, which operates on orders of magnitude lower than is possible with HPLC-UV or HPLC-Vis.
Need for Calibration: Calibration based on Beer-Lambert law applies to a limited range, expanding upper bounds of linearity (A>1), and high concentrations without mathematics invokes dilution.
Cutoff Absorbance: Certain solvents will not work for UV-Vis spectrophotometers as they absorb strongly below a certain wavelength. For instance, Methanol has a cut-off UV absorbance at 205 nm. Thus, the selection of blanking solvent is crucial while providing a methanol blank. This shows the spectral cutoff limitation for UV organic solvents.
Minimal Information Volume: UV-Vis collects volumetric information but is not capable of distinguishing largely overlapping spectra without the use of chromatography. Such complex mixtures are preferably analyzed by hyphenated HPLC-UV rather than direct UV-Vis spectroscopy.
To summarize, while UV-Vis is an excellent primary tool to have in the lab, its lack of versatility means that in some scenarios other techniques including HPLC, mass spectrometry, and infrared spectroscopy are needed to verify or analyze substances present in minute quantities.
8. Real-World Case Studies and Examples
Tablet Content Uniformity (Atenolol/Losartan): As mentioned previously, Shah et al. (2011) used UV-Vis techniques on a combination tablet. With the use of two wavelength simultaneous equation techniques, they performed rapid assays on all brands with pharmacopeial compliance.
Stability-Indicating Assay (Rifaximin): Another study focused on the antibiotic rifaximin and developed a UV-Vis method. Validation as per ICH guidelines demonstrated precision of RSD <1% intra- and inter-day) and accuracy. This method also has great potential as a stability-indicating method for tracking API under forced degradation showing UV-Vis’s application in stability testing.
Generic API Determination (Famciclovir): More recently, a tablet formulation of the antiviral famciclovir underwent evaluation with UV-Visible spectrophotometry. The method in 0.1 N HCl at λ_max=312 nm showed linearity between 2-12 μg/mL (r2=0.9978) and recovery values of 98.6-100.5% which corroborate accuracy. These case studies showcase UV-Vis is ideal for routine QC regardless of the class or category of the drug.
The given examples illustrate how various APIs from different drug classes can be analyzed and their results validated quickly using UV-Vis spectroscopy. In fact, assay and identity tests for thousands of pharmacopeial monographs are conducted using UV-Vis or HPLC-UV. Its accuracy and simplicity have made this technology a standard in both industrial and academic laboratories.
Conclusion
Analysis in the pharmaceutical sector still utilizes UV-Visible spectrophotometry as an essential tool. Drug assays, content uniformity tests, dissolution tests, and stability checks all require fast, simple, and dependable methods. With proper method development and validation, UV-Vis provides quantitative data compliant with regulatory requirements and corroborates quality assurance standards. Looking forward, UV-Vis technology is constantly improving. Modern devices come equipped with in-line process monitoring using fiber-optic probes, rapid spectral scanning with diode-array detectors, and spectral deconvolution software.
UV detection is combined with separation through hyphenated techniques such as HPLC with UV-PDA detectors to address complex samples. The UV spectra acquired could yield more information with the aid of advanced data analysis techniques, including chemometrics or AI algorithms. Furthermore, strong market growth in UV-Vis instruments, particularly in emerging areas, indicates sustained demand within the pharmaceutical and biotechnology industries. As the pharmaceutical sector evolves with new classes of drugs, biologics, and personalized medicine, UV-Vis spectrophotometry will continue to adapt and serve as the backbone for certifying safety, efficacy, and quality in pharmaceutical grade drugs.
References/Further Reading:
- ICH Q2(R1), Validation of Analytical Procedures: Text and Methodology (2005). International Council for Harmonisation.
- USP <857> Ultraviolet-Visible Spectroscopy (2019). United States Pharmacopeia.
- Shah SA et al. (2011). “Content Uniformity Determination of Atenolol and Losartan by UV Spectrophotometry,” Indian J. Pharm. Sci. 73(3). pmc.ncbi.nlm.nih.gov
- DataIntelo (2024). Spectrophotometer Market – Global Forecast & Trends. (Market report).
- JASCO Inc. (2024). “Instrumentation of a UV-Visible Spectrophotometer.” (Theory guide)

Naresh Bhakar is the Founder and Author at Pharmaguddu.com, bringing his extensive expertise in the field of pharmaceuticals to readers worldwide. He has experience in Pharma manufacturing and has worked with top Pharmaceuticals. He has rich knowledge and provides valuable insights and data through his articles and content on Pharmaguddu.com. For further inquiries or collaborations, please don’t hesitate to reach out via email at [email protected].