
Quality Control Specialist | Industry Experience
✓ Reviewed by: Pankaj Sharma - Quality Control Specialist
Reviewed for Quality Control accuracy, laboratory practices, analytical methods, and technical relevance
📅 Last Updated: October 9, 2026
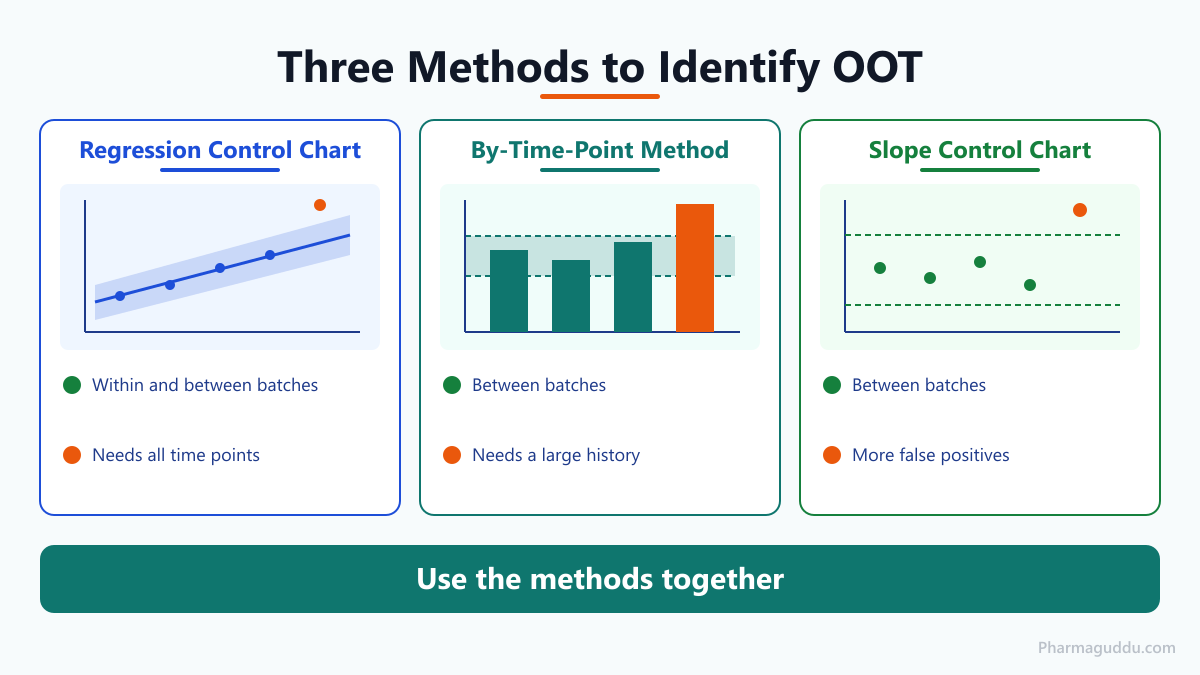
To identify OOT in stability studies, compare each new result with a statistical band built from historical batches. Three methods are common: the regression control chart, the by-time-point method (tolerance interval) and the slope control chart. A result that sits inside the specification but outside the band is Out-of-Trend (OOT). No regulator sets numeric OOT limits, so you must define the method and limits in your own SOP. Using the three methods together gives the safest view.
What Is OOT in Stability Studies?
Out-of-Trend (OOT) means a stability result that still meets specification but breaks the usual pattern of earlier data. Think of a car with a steady fuel gauge that suddenly drops faster. The tank is not empty, but something has changed.
Check out our other post on out of trend (OOT) results in pharmaceutical quality control. For the difference from specification failure, see OOT vs OOS in pharma.
How Do You Identify OOT Statistically?
You build a model of normal behaviour from historical batches, draw limits around it, and flag any new point outside those limits. The FDA OOS guidance (Level 2 revision, May 2022) covers specification failures only. It does not say how to find OOT, so each company justifies its own rules (ISPE, 2025).
The model needs data from the same process, the same test method and the same storage condition, such as 25 °C/60% RH. Mixing conditions gives wide, useless limits.
What Are the Three Main Methods?
According to ISPE Pharmaceutical Engineering, the PhRMA CMC Statistics and Stability Expert Teams described three methods that are widely used (ISPE, 2025).
Regression Control Chart
Purpose: checks a new batch against the expected line of result versus time.
Function: fit expected result = intercept + slope × time. Set limits at the expected value ± k × s, where s is the residual error of the regression. It works within one batch or between batches.
Common issues: it assumes normal, independent data with constant variance. According to Pharmaceutical Technology, it is unreliable with only about three points.
By-Time-Point Method
Purpose: compares a new batch with past batches at the same time point.
Function: at each time point, calculate a tolerance interval (mean ± k × s) from historical batches. A tolerance interval covers a stated share of future results with stated confidence. You may use “change from initial” to reduce time-zero differences. It makes no assumption about the shape of degradation.
Common issues: it needs many historical batches, and it works best at early time points. It compares batches only, not points within a batch.
Slope Control Chart
Purpose: detects a change in degradation rate.
Function: fit a least-squares line for each batch. Then set limits on the slopes using a tolerance interval from historical batches.
Common issues: narrow limits, such as ±2 z, give more false positives.
Which Method Should You Choose?
| Method | Compares | Detects | Main weakness |
|---|---|---|---|
| Regression control chart | Within and between batches | A point off the expected line | Needs all time points |
| By-time-point | Between batches | A point far from the batch mean at one time | Needs a large history |
| Slope control chart | Between batches | A faster or slower rate | More false positives |
Method choice changes the answer. On one published data set, a Shewhart-style limit flagged months 9–36, tolerance limits flagged nothing, and a confidence-limit approach flagged only the 18-month point (ISPE, 2025). That is a single author’s comparison, but it shows the risk.
How Do You Calculate OOT Limits? A Worked Assay Example
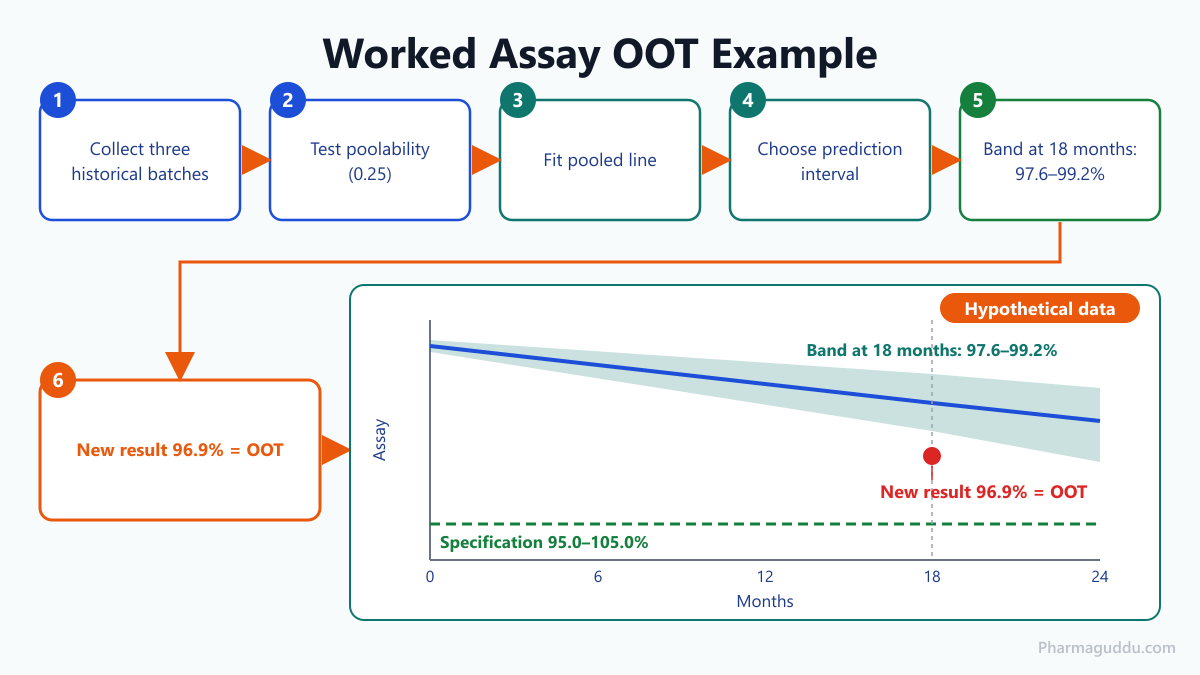
The numbers below are hypothetical and only show the steps. Spec: assay 95.0–105.0% label claim.
- Collect three historical batches, each tested at 0, 3, 6, 9, 12 and 18 months (n = 18 points).
- Test poolability. According to BioProcess International, ICH Q1E uses a 0.25 significance level, slope first, then intercept. Assume one common line fits.
- Fit the pooled line. Assume assay = 100.2 − 0.10 × months, with residual standard error Syx = 0.35.
- Choose the interval. A prediction interval suits a new individual result, so use it. The ISPE formula as printed is a confidence interval for the mean line. A prediction interval adds 1 under the square root.
- Calculate at 18 months. Expected value = 98.4. t (95%, 16 degrees of freedom) = 2.12. Half-width = 2.12 × 0.35 × √(1 + 1/18 + 100/630) = ±0.82. Band: 97.6–99.2%.
- Compare. The new batch reads 96.9% at 18 months. It passes the specification but falls below the band. It is OOT.
A confidence interval here would be only ±0.34, which flags far too many normal points.
What Limits and Settings Do You Need?
| Parameter | Typical value | Note |
|---|---|---|
| Regression chart limit | ±3 z (about 99.7%) | Pharm Tech case study |
| Slope chart limit | ±2 z (about 95.45%) | Narrower, more alerts |
| Regression band | 95% interval | ISPE modified approach |
| Poolability level | 0.25 | ICH Q1E |
| Alert / action | About ±2 SD / ±3 SD | In-house practice |
Exact values depend on your SOP. They are industry practice, not regulatory values.
A common question is how many batches you need. Three or more is a practical start, and limits are weak with fewer. Add batches as they finish and recalculate. For tolerance intervals, a small history gives a larger k factor, which widens the limits and cuts false alarms.
What Do Regulators Expect?
Regulators expect a written stability program and a review of its data. 21 CFR 211.166 and 211.180(e) are the usual hooks for trending. ICH Q1A(R2) and Q1E give the regression and pooling logic that OOT models borrow. Reusing the Q1E pooled model for OOT limits keeps both consistent. For background on study design, see accelerated stability study guidelines.
Recent Technology Trends
- ICH Q1 draft (April 2025): ICH reached Step 2b on a consolidated Q1 guideline replacing Q1A–F and Q5C. EMA shows publication on 30 April 2025 and consultation to 30 July 2025. Trade summaries say it adds modelling and Bayesian options, but the text was not read here. No final Step 4 was found.
- ISPE paper (March–April 2025): proposes ANCOVA-based model selection with 95% intervals that can run in Excel.
- Automated dashboards: vendors describe stability dashboards with automatic OOT alerts. Their performance claims are unverified. Any such software needs validation and data integrity controls.
Common Problems and Troubleshooting
Too Many False Alarms
Possible causes: limits too narrow, history too small, or batches pooled that should not be.
Corrective actions: retest poolability, widen to a tolerance or prediction interval, and add batches.
No Alarms When You Expect Some
Possible causes: tolerance limits that are too wide, or a mixed data set.
Corrective actions: compare with the regression band and review the data set.
After an OOT Flag
Check the lab first: calculation, integration, standard, column or instrument. Then review the chamber log, sampling and container closure, then the batch and raw material records. Finally, refit the model and check that the one-sided 95% limit still meets the specification at the labelled shelf life. Typical causes are analytical error, chamber or handling problems, or real faster degradation.
Expert Tips
- Write the rule first. Define method, interval type and limits in the trending SOP before any data arrives.
- Name the interval. State whether you use a confidence, prediction or tolerance interval, and why.
- Use two methods. One chart can miss what another catches.
- Review limits often. Recalculate after new batches and after method or process changes.
- Never delete a point by statistics alone. Remove a result only with a documented, proven cause.
- Keep spreadsheets controlled. Lock formulas and validate them.
In one stability review I joined, most early flags traced back to a changed reference standard, not to the product.
Frequently Asked Questions
FDA’s OOS guidance does not define how to identify OOT. Companies write their own OOT definitions and statistical rules in SOPs and must justify them. Inspectors expect the rule to be written, applied consistently and linked to a documented investigation when a result is flagged.
No single method wins. The Pharmaceutical Technology authors recommend using regression, by-time-point and slope methods together, because each one catches a different kind of change. Another comparison found the regression control chart most reliable. Choose based on your data size and document the reason.
Yes. OOT means the result breaks the expected pattern even though it meets specification. For example, an assay of 96.9% passes a 95.0–105.0% limit but may still fall outside the band. It needs assessment, not automatic rejection.
With few historical batches, the standard deviation is uncertain. A tolerance interval uses a k factor larger than the normal z value to allow for this. The limits become wider, which cuts false alarms. The k value depends on the number of batches, coverage and confidence.
No. The batch is still within specification. First confirm the result is real by checking for lab error. If the trend is real, refit the regression and check that the proposed shelf life still holds. Then monitor or take corrective action.
Yes, for regression and interval calculations, as shown in the 2025 ISPE paper. Validate the spreadsheet, lock the formulas and control access. Larger programs often move to validated LIMS or statistical software with audit trails.
Summary
OOT in stability studies is found by comparing new results with limits built from historical batches. Use regression, by-time-point and slope methods together, choose the interval type on purpose, and write the rules in your SOP. Investigate the lab first, then the product.
References
- Identifying Out-of-Trend Data in Stability Studies, ISPE Pharmaceutical Engineering (2025)
- Methods for Identifying Out-of-Trend Results in Ongoing Stability Data, Pharmaceutical Technology
- Investigating OOS Test Results for Pharmaceutical Production, Level 2 revision (May 2022), US FDA
- ICH Q1 guideline on stability testing of drug substances and drug products (draft), EMA
- Comprehensive Stability Assessment of Biotechnological Products, Part 2, BioProcess International
- Shortcut: Out-of-Trend Analyses in Stability Studies, GMP Compliance (ECA)
- ICH Q1A(R2) and Q1E, Stability Testing and Evaluation of Stability Data, ICH (2003)

Pankaj Sharma — Quality Control Specialist
Pankaj Sharma is a pharmaceutical QC professional who reviews our technical content for GMP accuracy, laboratory practices, and regulatory relevance.