
Quality Control Specialist | Industry Experience
✓ Reviewed by: Pankaj Sharma - Quality Control Specialist
Reviewed for Quality Control accuracy, laboratory practices, analytical methods, and technical relevance
📅 Last Updated: October 9, 2026
An Out-of-Specification (OOS) result falls outside an approved limit, so the batch cannot be released until the investigation closes. An Out-of-Trend (OOT) result is still inside the limit but breaks the usual pattern of earlier data. OOT is an early warning, not a failure. Out-of-Expectation (OOE) is a milder case: an in-spec result that simply looks unusual. This article shows how OOT vs OOS in pharma differ, how to investigate each, and what each means for batch release.
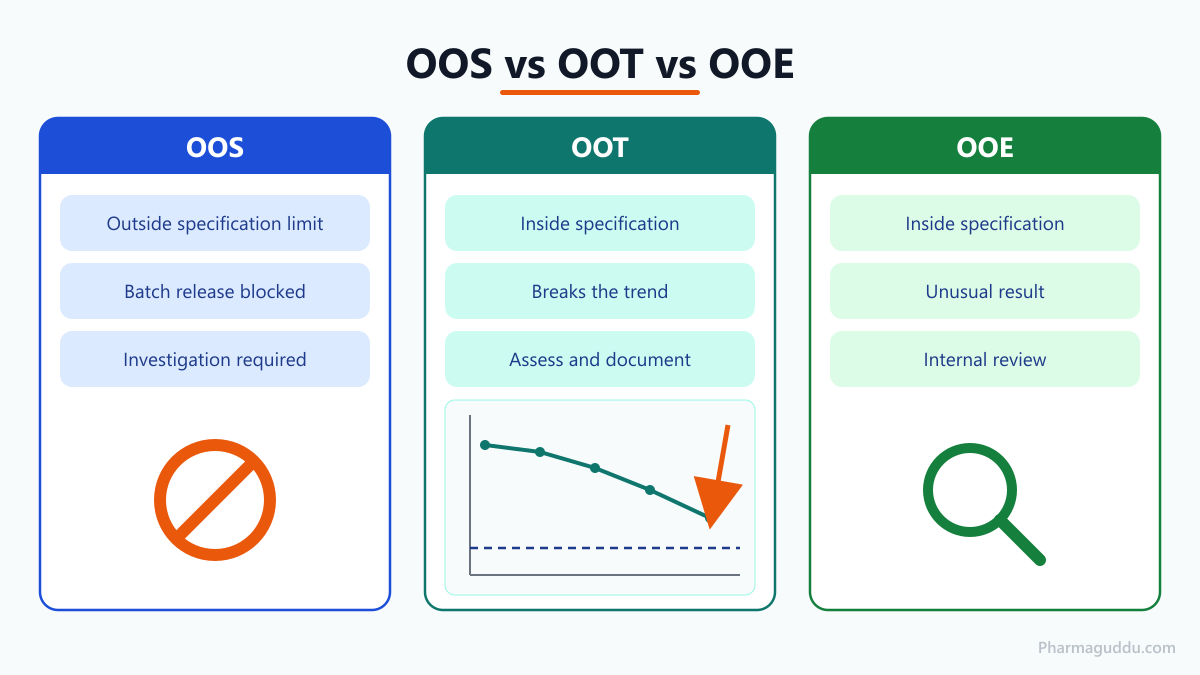
This panel shows how OOS, OOT and OOE differ in limit, meaning and release impact.
What Is the Difference Between OOT vs OOS in Pharma?
OOS is a failure against a written limit. OOT is a warning about direction. Think of a car: OOS is driving above the speed limit, while OOT is the speed creeping up every minute while you are still legal.
Out-of-Specification (OOS) means any test result outside the specification or acceptance criteria. According to the FDA guidance on investigating OOS results (Level 2 revision, May 2022), this covers limits in drug applications, official compendia and the manufacturer’s own limits, including in-process laboratory tests.
According to GMP Insiders, Out-of-Trend (OOT) means a result that is still within specification but departs from the expected pattern of earlier data for the same product, batch or method. There is no official regulatory definition of OOT, so each site defines it in its SOP.
Out-of-Expectation (OOE) means an in-spec result that is unusual compared with scientific expectation or past behaviour, for example a new small impurity peak that nobody can explain.
Here is a hypothetical example. An assay limit is 95.0–105.0%. A result of 92.1% is OOS. A stability assay of 98.9% at 3 months, 97.8% at 6 months and 95.9% at 9 months is still in spec, but the fall is steep. That is OOT.
Related Topic: Out of trend (OOT) results in Pharmaceutical
How Does the Decision Logic Work?
Compare every result with three questions, in this order. The first “yes” decides the path.
- Is the result outside the specification? If yes, start an OOS investigation.
- Is it inside the specification but outside the OOT limit? If yes, start an OOT assessment.
- Is it inside both but unusual to a trained analyst? If yes, record it as OOE and review it.
If all three answers are no, the result is normal and the batch moves on.
OOS vs OOT vs OOE: Comparison Table
| Feature | OOS | OOT | OOE |
|---|---|---|---|
| Compared with | Specification limit | Earlier data (trend) | Scientific expectation |
| Regulatory status | Defined in FDA and MHRA guidance | No official definition | Not a regulatory term |
| Batch release | Blocked until investigation closes | Not blocked automatically | Not blocked |
| First action | Laboratory investigation | Check data, then trend assessment | Internal review |
| Decision owner | Quality unit | Quality unit, risk-based | QC with QA review |
| Typical outcome | Batch disposition, CAPA | Monitoring, extra testing, maybe CAPA | Note; act if it recurs |
What Are the Steps of an OOS Investigation?
The FDA guidance moves from a laboratory investigation, to a full-scale investigation including manufacturing, to a final evaluation and batch decision. The MHRA guidance (updated 2018) names these Phase Ia/Ib, Phase II and Phase III. For a full SOP format, read the Pharmaguddu OOS investigation procedure.
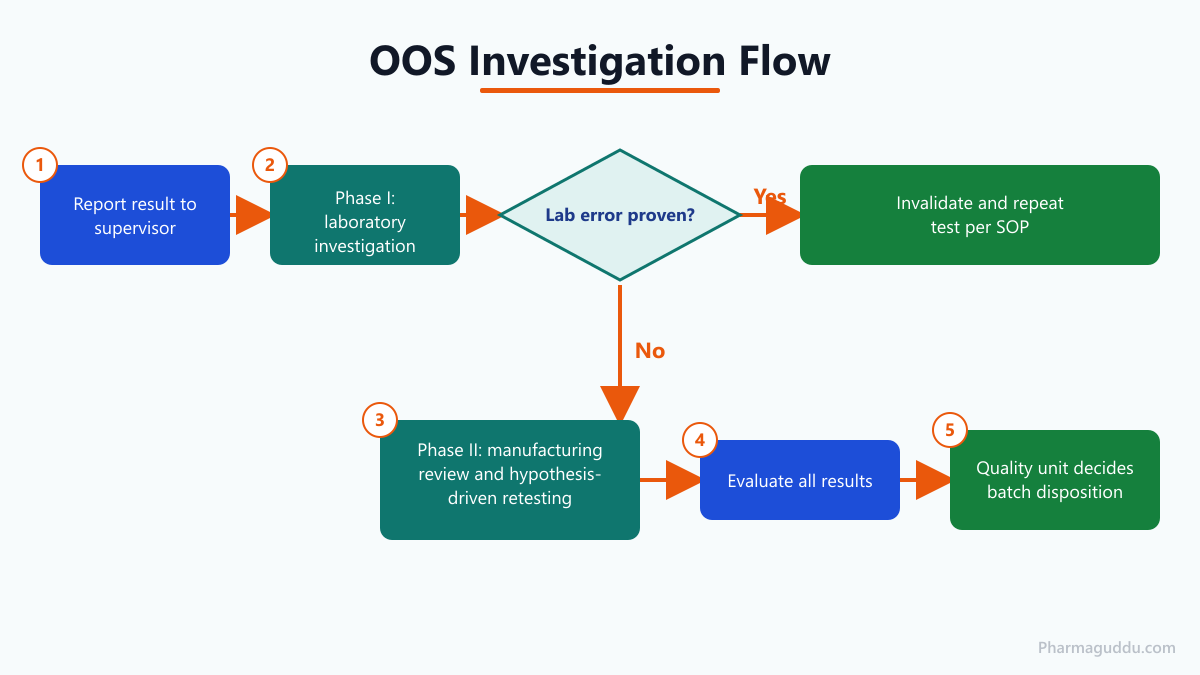
- Report the result to the supervisor at once. Keep the original data. Never delete it.
- Phase I: the laboratory looks for an assignable error, such as a wrong dilution, a calculation mistake or an instrument fault.
- If a proven lab error exists, invalidate the result and repeat the test as the SOP says.
- If no lab error is found, expand the work: a cross-functional team reviews manufacturing, while the lab runs hypothesis-driven retesting.
- Evaluate all results together. The quality unit decides the batch disposition: release, reject or rework as allowed.
Retesting alone never cancels an OOS result. You need a proven cause.
How Do You Handle an OOT Result?
You assess it, you do not reject the batch. The goal is to learn whether the drift is real and whether it threatens shelf life.
- Check the raw data, calculation and system suitability.
- Look for lab events: new column, new standard, new analyst.
- Compare with other batches and time points.
- Judge the effect on shelf life using ICH Q1E regression.
- Decide: keep monitoring, add a test point, or open a deviation and CAPA.
- Record the outcome and include it in the annual product review.
On one stability study I reviewed, a slow assay decline was flagged at the 9-month point. The cause was a real packaging weakness, so we fixed it before any result went out of limit.
Key Parameters for OOT and OOS Control
| Item | Typical practice | Note |
|---|---|---|
| OOT alert limit | 95% prediction interval from regression, or control-chart limits of ±2 or ±3 SD | Set in SOP and justify statistically |
| OOS lab investigation time | 30 business days in one company SOP | Not an FDA requirement |
| Retest replicates | Often six, by a second analyst, in one SOP | MHRA moved to hypothesis-based retesting |
| History needed for OOT limits | Enough batches to be statistically valid | Define in SOP |
Exact values depend on the company and the product; always follow your site SOP.
Which Standards and Regulations Apply?
- US: 21 CFR 211.192 (investigating discrepancies), 211.165 (testing before release) and 211.180(e) (annual product review, the base for trending). The FDA OOS guidance is dated May 2022. The FDA has no OOT guidance.
- EU: EudraLex Vol 4 Chapter 6 (2014) expects data to be recorded so trends can be evaluated, and OOT or OOS data to be investigated.
- UK: the MHRA OOS guidance expects release data to be trended on control charts and stability data by regression.
- ICH Q1E (2003): the statistical base for stability evaluation.
Recent Technology Trends
- April 2025: ICH released a consolidated Q1 stability draft (Step 2b), reported by RAPS. It would absorb Q1E content. It was not final at the time of research, so Q1E still applies.
- May 2022: the FDA OOS guidance was revised and now says “quality unit” and clarifies outlier and averaging handling.
- 2025: vendors describe LIMS tools with AI that flag outliers and trends. These are vendor claims, not regulator guidance. Validate any such tool before use and keep data integrity controls, as in ALCOA principles.
Common Problems and Troubleshooting
Testing into compliance
Possible causes:
- Repeated retests until a passing number appears.
- Averaging a failing result with passing ones.
Corrective actions:
- Fix the retest plan in the SOP before testing.
- Never average to hide an OOS.
OOT ignored because “it passes”
Possible causes:
- No trending routine.
- Staff think only OOS matters.
Corrective actions:
- Plot stability and release data at every time point.
- Train analysts to report drift early.
OOT limits copied from another product
Possible causes:
- Too little history.
- One template used for all products.
Corrective actions:
- Set limits from the product’s own data.
- Review limits yearly.
For a worked root cause example, see this product investigation report.
Expert Tips
- Write the OOT rule first. Define limits in the SOP before the first batch is tested.
- Keep every raw result. Auditors ask for the first value, not the last.
- Stop and call. Tell the supervisor before you prepare any retest.
- Trend by test type. Assay, impurities, dissolution and water behave differently.
- Close the loop. Feed OOT findings into annual product review and CAPA.
- Use a second pair of eyes. A simple data check often finds the lab error in minutes.
Frequently Asked Questions
No. An OOT result is within specification, so the batch is not failed on that basis. But you must assess the trend, document the decision and check the effect on shelf life and other batches. The quality unit decides whether extra action is needed.
No. The FDA has OOS guidance but no OOT guidance. Companies handle OOT through SOPs, supported by ICH Q1E, ICH Q10 and annual product review under 21 CFR 211.180(e). Your SOP must state the method and limits clearly.
Only if you prove an assignable laboratory cause. A passing retest on its own is not a reason to discard the original result. The MHRA moved from fixed retest counts to hypothesis-driven testing for this reason.
Yes. A drifting trend may cross the specification limit at a later time point. That is why OOT works as an early warning and why you should act while the result is still in spec.
No. CAPA depends on the risk assessment and on whether a real cause or process drift is confirmed. Many OOT cases close with documented monitoring only.
According to Pharmaceutical Technology, common tools are regression with a prediction interval, control charts, slope comparison between lots and Z-scores. One published comparison found a regression control chart detected OOT best, with a false-alarm rate slightly above 5%.
Summary
OOS breaks a written limit and blocks release until the quality unit closes the investigation. OOT breaks the pattern while staying in spec, so it needs a documented, risk-based assessment. OOE is an internal review item. Define all three in your SOP, set limits from real data, and keep every original result.
References
- Investigating OOS Test Results for Pharmaceutical Production – Level 2 revision, US FDA
- FDA OOS guidance PDF, US FDA (2022)
- Out of specification investigations, MHRA (2018)
- EudraLex Vol 4 Chapter 6 Quality Control, European Commission (2014)
- Differences between OOS, OOT and OOE results, GMP Insiders
- Out of Expectation results guide, Assyro
- Comparing methods for determining OOT stability test results, Pharmaceutical Technology
- ICH releases overhauled stability guideline, RAPS (2025)
- How AI is transforming LIMS data management in 2025, ConfidentLIMS
- ICH Q1E Evaluation of Stability Data, ICH (2003)

Pankaj Sharma — Quality Control Specialist
Pankaj Sharma is a pharmaceutical QC professional who reviews our technical content for GMP accuracy, laboratory practices, and regulatory relevance.