
Quality Control Specialist | Industry Experience
✓ Reviewed by: Pankaj Sharma - Quality Control Specialist
Reviewed for Quality Control accuracy, laboratory practices, analytical methods, and technical relevance
📅 Last Updated: October 9, 2026
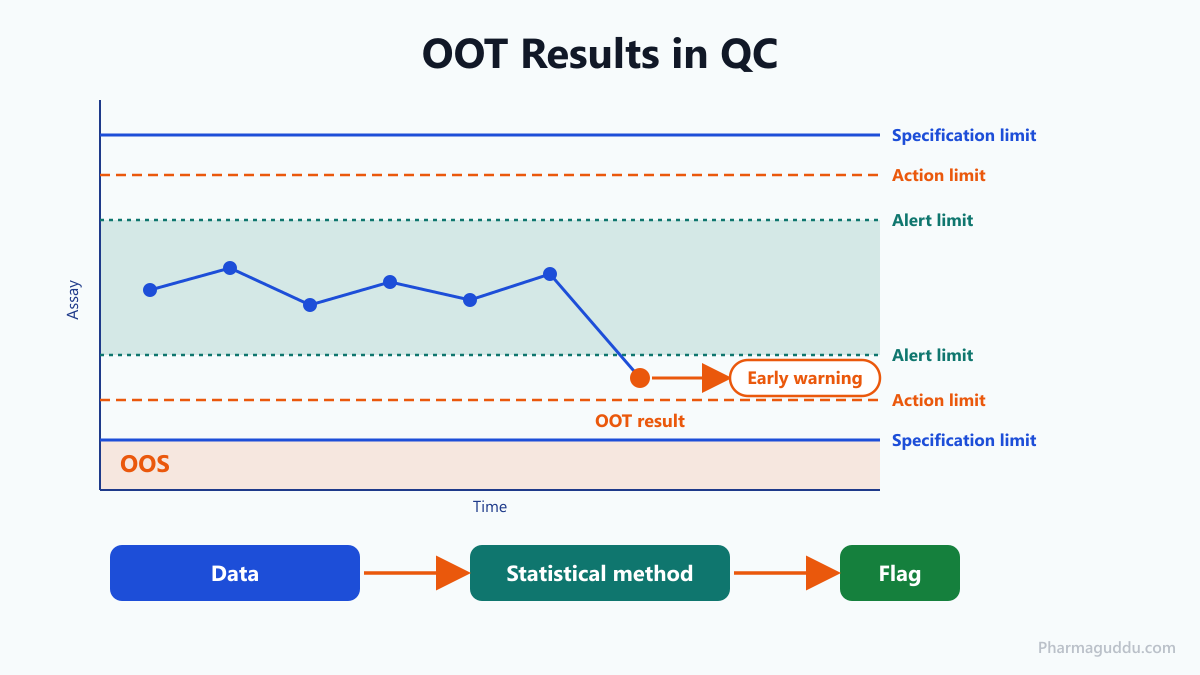
An out of trend (OOT) result is a test result that still meets specification but does not follow the expected or historical pattern of the product. In pharmaceutical quality control, it works as an early warning, because you see the drift before it becomes an out of specification (OOS) failure. Labs detect OOT by comparing new data with earlier results using alert limits, control charts or regression. It applies to stability studies, batch release data, in-process checks and environmental monitoring. No regulator gives a numeric OOT limit, so each company sets its method in an SOP and investigates flagged results on a risk basis.
What Are Out of Trend (OOT) Results in Pharmaceutical Quality Control?
An OOT result is a data point that sits inside the specification but outside the pattern you normally see. Think of an assay that has read 99–100% for two years and suddenly reads 96%. The limit is 95.0–105.0%, so it passes. But something changed.
According to ISPE’s Pharmaceutical Engineering (March–April 2025), the comparison is made against earlier results of the same batch, other stability batches or historical data.
Definition
Out of trend (OOT) is a test result that meets its specification but deviates from the expected or historical pattern of results for that product, batch or process. No FDA or EU regulation defines it, so the working definition lives in your own SOP.
How Does OOT Detection Work?
OOT detection compares each new result with a statistical expectation built from past data, then flags results that fall outside the chosen limits. You collect data, decide what “normal” looks like, set limits around it and review every new point against those limits.
The expectation depends on the data type. Stability data follow a time-dependent line, while release and in-process data scatter around a mean.
What Is the Working Principle Behind OOT Methods?
The principle is simple: input data, a statistical model, then a flag. Several methods exist, and ECA Academy, summarising a PhRMA CMC statistics team paper, lists the main ones for stability data.
- Regression control chart: fits a line through the data and draws limits around the expected values.
- By-time-point method: builds a tolerance interval (mean ± k·s) at each time point from historical batches. It needs no degradation model.
- Slope control chart: tracks batch-to-batch variation in the fitted slopes.
- Z-score method: described in the literature as a fourth option.
According to ECA Academy, for routine QC and process data, the ECA SOP on trend identification points to SPC tools: X-bar and I-MR charts, CUSUM and EWMA. Stability evaluation also links to ICH Q1E, where a prediction interval around the fitted line can serve as the trend limit.
According to ISPE Pharmaceutical Engineering, older sites used fixed rules, such as a change of more than ±5% from the initial result or ±3% from the previous one. They are easy to apply, but ISPE notes they have no statistical basis.
What Are the Main Elements of an OOT Control System?
An OOT system needs five elements: a data source, a statistical method, defined limits, an investigation SOP and a reviewer. If one is missing, flags either never appear or never get closed.
Data source and historical dataset
Purpose: gives the baseline.
Function: holds assay, impurity, dissolution and water results with batch, time point and method details.
Common issues: mixed methods or old data after a method change distort the baseline.
Statistical method
Purpose: converts history into limits.
Function: regression, tolerance interval or control chart.
Common issues: a method that is too tight floods QA with false flags; too loose, and drift goes unseen.
Alert and action limits
Purpose: decides when to act.
Function: alert limits trigger a look, action limits trigger a formal investigation.
Common issues: limits copied from another product without checking.
Investigation SOP
Purpose: defines who does what.
Function: sets triggers, timelines, documentation and CAPA links.
Common issues: vague wording such as “significant change” with no definition.
Review and trending report
Purpose: makes sure someone looks.
Function: periodic QA review of trends, feeding management review under the ICH Q10 pharmaceutical quality system (Pharmaceutical Quality System (PQS), ICH Q10).
Common issues: charts exist, but nobody signs them.
What Are the Steps of an OOT Investigation?
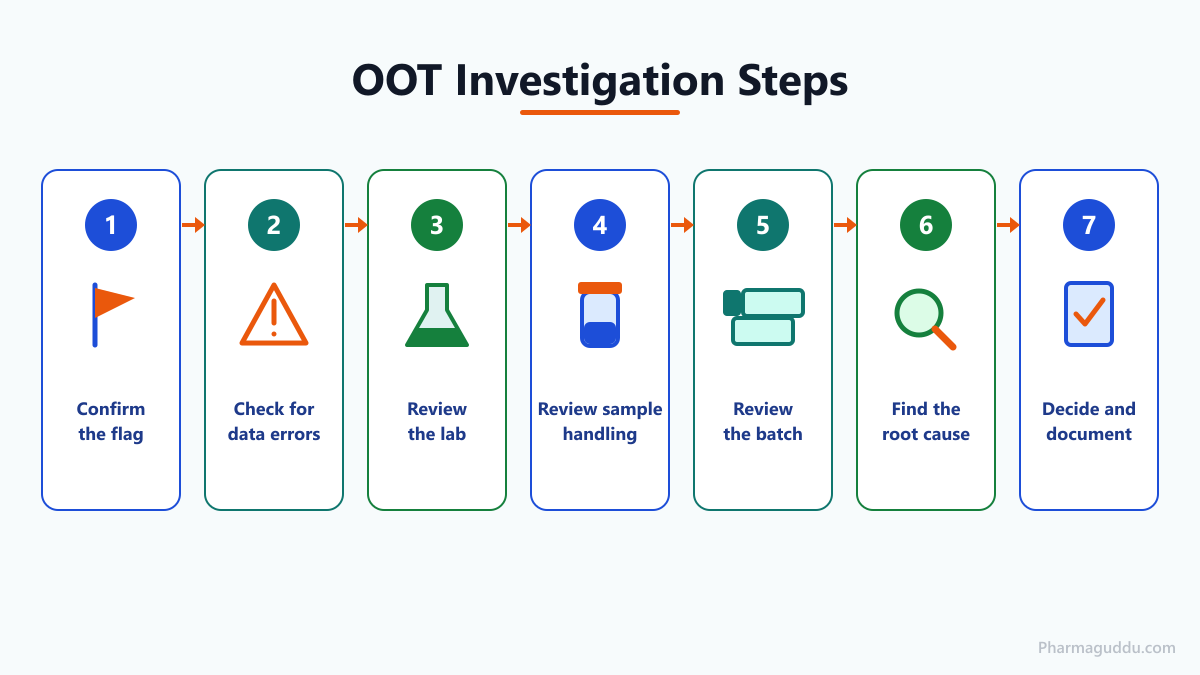
An OOT investigation moves from the cheapest checks to the most expensive. According to Assyro, the sequence below follows common industry practice described by OOT SOP.
- Confirm the flag. Check the limits and the historical data used.
- Check for data errors. Look for transcription mistakes and calculation errors.
- Review the lab. Check analyst technique, instrument calibration, standards and sample preparation.
- Review sample handling. Check storage conditions, chamber records and transport.
- Review the batch. Study the batch record, raw materials and process history.
- Find the root cause. Use a fishbone diagram or 5-Why.
- Decide and document. State whether the trend is real, assess batch impact and raise CAPA if needed.
A short, illustrative example helps. Suppose assay at 0, 3 and 6 months reads 100.2%, 99.6% and 99.1%, a slope of about −0.2% per month. The 9-month result comes back at 96.8%. It passes a 95.0–105.0% limit, but it sits far below where the line predicts (about 98.5%). That is an OOT flag, and you investigate before the next time point.
If a stability point does move, the follow-up often runs through a non-conformance route; see Non-Conformance Report (NCR) and Their Handling in Pharmaceuticals for the follow-up flow.
Where Are OOT Results Applied in QC?
Most articles cover only stability, but OOT trending applies wherever you collect repeat data. Typical uses include:
- Stability studies: assay, impurities, dissolution and water content.
- Batch release data: assay, content uniformity and dissolution of tablets (see Solid Dosage Forms: Tablets, Types, Quality Control Test).
- In-process checks: hardness, weight and yield.
- Purified water, utilities and environmental monitoring data.
What Are the Benefits and Limitations of OOT Trending?
Benefits
- Catches drift before an OOS result.
- Shows process or method changes early.
- Supports regulator expectations for data review.
Limitations
- Needs enough historical data; a new product has little.
- Statistical limits can give false alarms.
- Each company sets limits, so results are not comparable across sites.
What Are the Key Parameters for Setting OOT Limits?
No regulator gives numbers. The values below are commonly seen approaches from industry sources, not requirements, and your SOP must justify whichever you choose.
| Parameter | Typical approach | Effect | How to control |
|---|---|---|---|
| Alert limit (SPC) | About 2 SD from historical mean | Triggers a look at the data | Define in SOP per test |
| Action limit (SPC) | About 3 SD from historical mean | Triggers formal investigation | Review yearly |
| Regression limit (stability) | 95% interval around the fitted line | Flags points off the expected line | Justify the interval and model |
| Simple % rule (older) | ±5% from initial; ±3% from previous | Easy but not statistical | Replace with a statistical method |
| Bootstrap resamples (ISPE example) | 10,000 | Stabilises interval estimates | Use validated spreadsheet or software |
Exact values depend on the company and product; always follow your SOP.
How Is OOT Different From OOS and OOE?
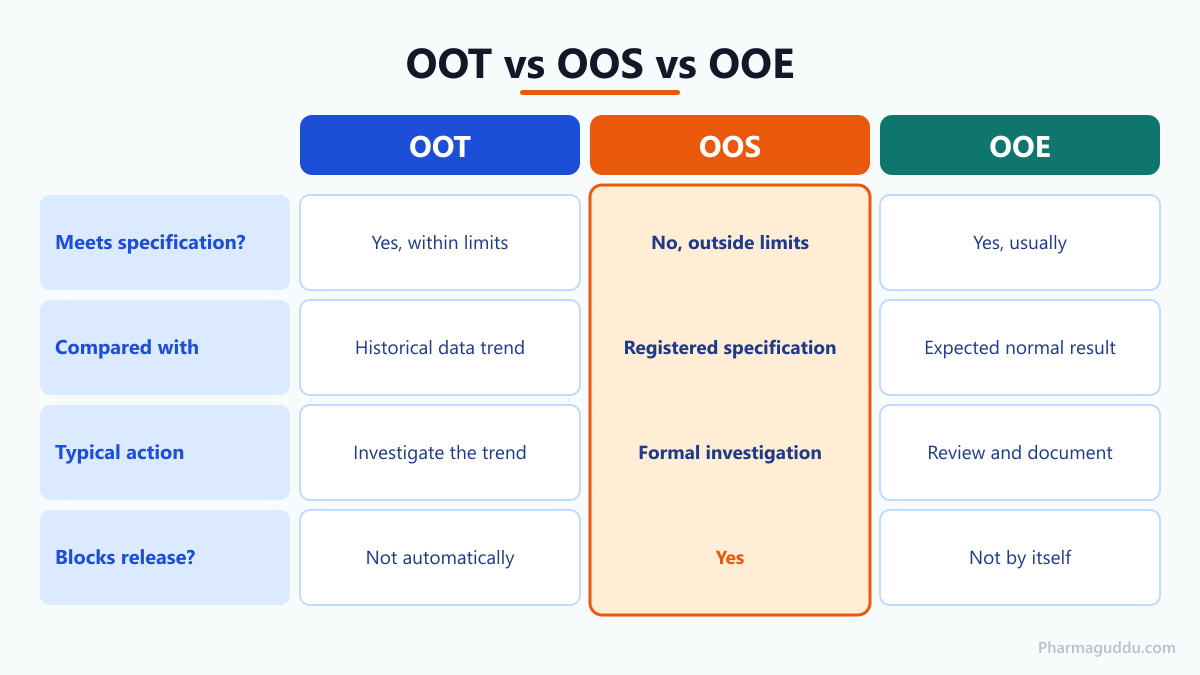
OOS fails a specification, OOT passes it but breaks the pattern, and OOE is a single result that differs from what you expected for that batch.
| Feature | OOS | OOT | OOE |
|---|---|---|---|
| Meets specification? | No | Yes | Yes |
| Compared with | Specification limit | Historical or expected trend | Expected value for that batch |
| Typical action | Formal OOS investigation (phase I laboratory, phase II full-scale) | Risk-based investigation | Check and often handled with OOT |
| Blocks release? | Usually yes until resolved | Not automatically | Not automatically |
What Do Regulations Say About OOT?
No major regulator defines OOT, but several documents expect trend review.
- EudraLex Vol 4, Chapter 6 (in operation October 2014): requires data such as test results and yields to be recorded so trends can be evaluated, and says out-of-trend or out-of-specification data must be addressed and investigated (paragraph 6.9).
- FDA OOS guidance (Level 2 revision, May 2022): covers OOS results. As ISPE describes it, it does not set out how to identify OOT.
- 21 CFR 211.192 and 211.180(e): require investigation of unexplained discrepancies and periodic record review.
- ICH Q10 (2008): expects process and product quality monitoring, CAPA and management review.
What Are the Recent Technology Trends in OOT Control?
Little has changed in regulation, but practice is moving toward statistics and automation.
- April 2025, ISPE: a Pharmaceutical Engineering article proposes ANCOVA regression with 95% intervals and bootstrapping, built in Excel/VBA. It is one proposed method, not a standard.
- April 2025, ICH: a draft consolidated Q1 stability guideline reached Step 2b on 11 April 2025 to replace Q1A–F and Q5C. Check its current status before relying on it.
- 2025, LIMS vendors: products now market automatic OOS/OOT flagging and trend dashboards. This is vendor material and shows no regulatory acceptance.
What Are the Common Problems in OOT Investigations?
False OOT flags from HPLC
Possible causes: column ageing, mobile phase error, standard degradation, integration changes.
Corrective actions: check system suitability, re-prepare standards, review integration events and the audit trail.
One point far from the mean
Possible causes: sample preparation error, transcription mistake, a bad vial.
Corrective actions: verify raw data, retest only where the SOP allows, and never average a result away.
Slow drift toward the limit
Possible causes: real degradation, packaging change, raw material variation, chamber excursion.
Corrective actions: check chamber records, compare other batches, assess shelf-life impact.
Sudden shift after a change
Possible causes: new method, new column supplier, process change.
Corrective actions: link to change control and rebuild the baseline for the new condition.
Widening variability
Possible causes: worn equipment, inconsistent analysts, unstable process.
Corrective actions: check calibration and training, then review process capability.
On most plants I’ve worked with, the first suspect is the lab. In one case I recall, a slow assay decline traced back to a standard solution kept past its expiry; the trend vanished once fresh standards were made.
Expert Tips
Write limits before data arrives. Set alert and action limits in the SOP, not after you see a bad point.
Trend by method version. Never mix results from before and after a method change.
Plot, don’t just tabulate. A chart shows drift that a table hides.
Avoid testing into compliance. Retesting to move a point back inside the trend is a data integrity problem.
Review the control sample too. Retention samples can confirm whether a drift is real; see SOP on Withdrawal, Storage, Observation & Destruction of Control Sample.
Keep instruments trended. Calibration drift shows up in your results first. Review the list of quality control equipment in your lab against your trending plan.
Frequently Asked Questions
Often yes, if the result is within specification and a documented risk assessment finds no impact on quality. OOT does not automatically block release the way OOS usually does. Your SOP and the product risk decide, and QA must approve the justification.
It depends on your SOP. Many sites treat a confirmed OOT as an investigation record and raise a deviation or CAPA only when a real cause or product impact is found. A lab error alone may need only a correction and a record.
It is easy to apply, but ISPE notes it has no statistical basis. Inspectors usually prefer a justified statistical method. If you keep a fixed percentage rule, document why it suits the product and the test.
Causes include analytical error (sample preparation, column or instrument change), storage or chamber excursions, raw material variation, and real process drift or product degradation. Always rule out lab and data causes first.
Start it when a result crosses the action limit defined in your SOP. Many sites also review alert-limit breaches, but with a lighter check. Do not wait for the next time point if the shelf life may be at risk.
Yes. A downward assay trend toward the lower limit can reach OOS at a later time point. That is why OOT works as an early warning, and why you assess the projected shelf life when you confirm one.
Summary
OOT results are in-specification results that break the expected pattern. Define OOT in your SOP, choose a justified statistical method, set alert and action limits, and investigate from lab causes outward. No regulator sets numbers, so documentation is your protection.
References
- Identifying Out-of-Trend Data in Stability Studies, ISPE Pharmaceutical Engineering
- How to identify Out-of-Trend Results in Stability Studies?, ECA Academy
- ECA SOP: Methods for the Identification of Trends in Production and QC, ECA Academy
- Out of Trend Results: The Complete Investigation and Compliance Guide, Assyro
- FDA Investigating OOS Test Results for Pharmaceutical Production (Level 2 revision), US FDA
- EudraLex Vol 4 Chapter 6 Quality Control, European Commission
- ICH revises Q guideline advancing stability testing standards, Pharmaceutical Online
- ICH Q1E Evaluation of Stability Data, ICH, Step 4, 2003
- ICH Q10 Pharmaceutical Quality System, ICH, Step 4, 2008
- 21 CFR Part 211 (211.180(e), 211.192), US FDA

Pankaj Sharma — Quality Control Specialist
Pankaj Sharma is a pharmaceutical QC professional who reviews our technical content for GMP accuracy, laboratory practices, and regulatory relevance.