
Quality Control Specialist | Industry Experience
✓ Reviewed by: Pankaj Sharma - Quality Control Specialist
Reviewed for Quality Control accuracy, laboratory practices, analytical methods, and technical relevance
📅 Last Updated: October 10, 2026
An OOT investigation in stability studies is a step-by-step check of a result that meets specification but breaks the expected trend. Start by confirming the flag is real: re-check the calculation, data entry and plotted point. Then check the laboratory, the stability chamber and sample handling, and the batch and raw-material records. Next, refit the trend with the new point and confirm the product stays within specification to the end of shelf life. Finish with a written conclusion: close it, document it, or raise a deviation and CAPA. No regulator sets numeric OOT limits, so your SOP must define the trigger.
What Is an OOT Investigation in Stability Studies?
An OOT investigation in stability studies is the documented review you start when a stability result looks unusual but still passes its limit. Think of a car speedometer reading 55 km/h in a 60 km/h zone when you normally drive at 40. You are not speeding, but something has changed.
Out-of-Trend (OOT) means a result that is still within specification but breaks the usual pattern seen at earlier time points or in other batches. According to the CASRAI guide on OOT investigation, it can be an early warning of a future Out-of-Specification (OOS) result.
How Does the Investigation Work?
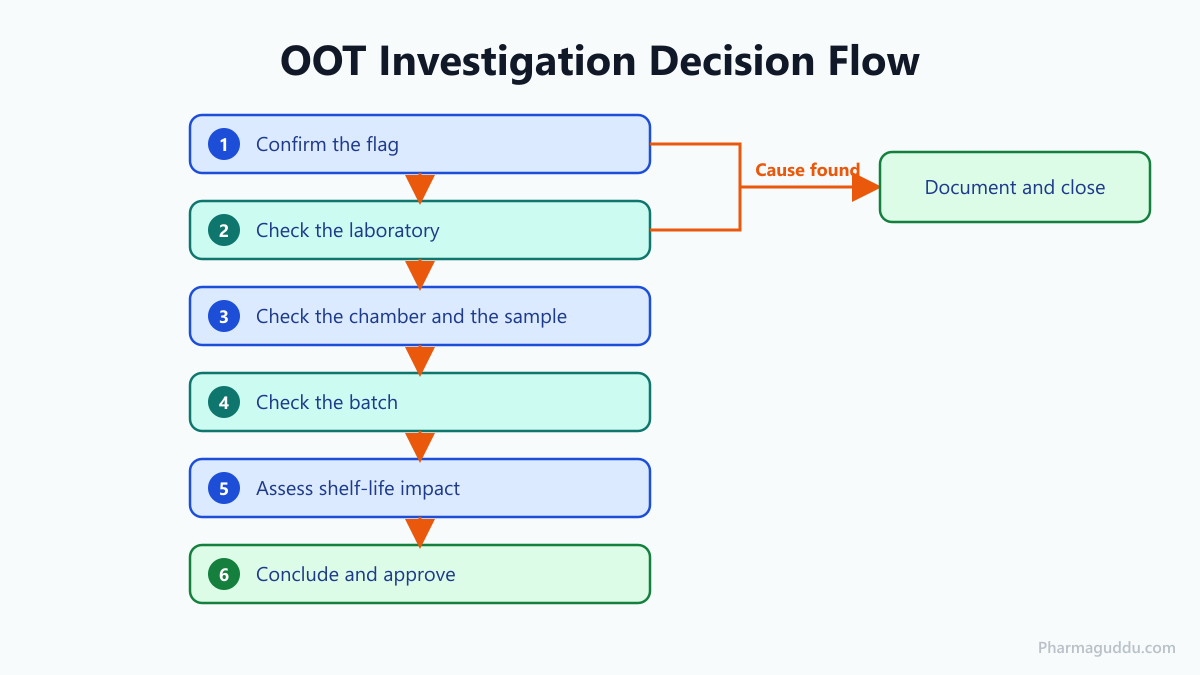
You work from the cheapest, fastest check to the most expensive one. Each step either finds a cause and stops, or passes the question to the next step. This is good practice, not a legal text. According to the CASRAI guide on OOT investigation, the order is: confirm the flag, check for an analytical cause, then assess the trend impact.
Many SOPs borrow the phased logic of the FDA OOS guidance (Level 2 revision, May 2022): laboratory first, then wider review. According to US FDA, that guidance covers OOS results only. It does not define OOT. For the statistical side of detection, read how to identify OOT in stability studies.
Step-by-Step OOT Investigation Flow
Use the same order every time. A fixed order is also what an inspector expects to see.
- Confirm the flag. Re-check the calculation, the raw-data entry and the plotted point. According to the CASRAI guide on OOT investigation, a transcription or plotting error is a valid root cause and closes the case quickly.
- Check the laboratory. Look at the one attribute and time point only. Review instrument calibration, reagent and standard lots, analyst, method changes and sample preparation.
- Check the chamber and the sample. Review the chamber record, pull log, closure and container condition for the flagged pull.
- Check the batch. Review the batch record, raw-material lots and any deviations. Compare other batches.
- Assess shelf-life impact. Refit the model with the new point and test the projection.
- Conclude and approve. Write the conclusion, the evidence and the next action.
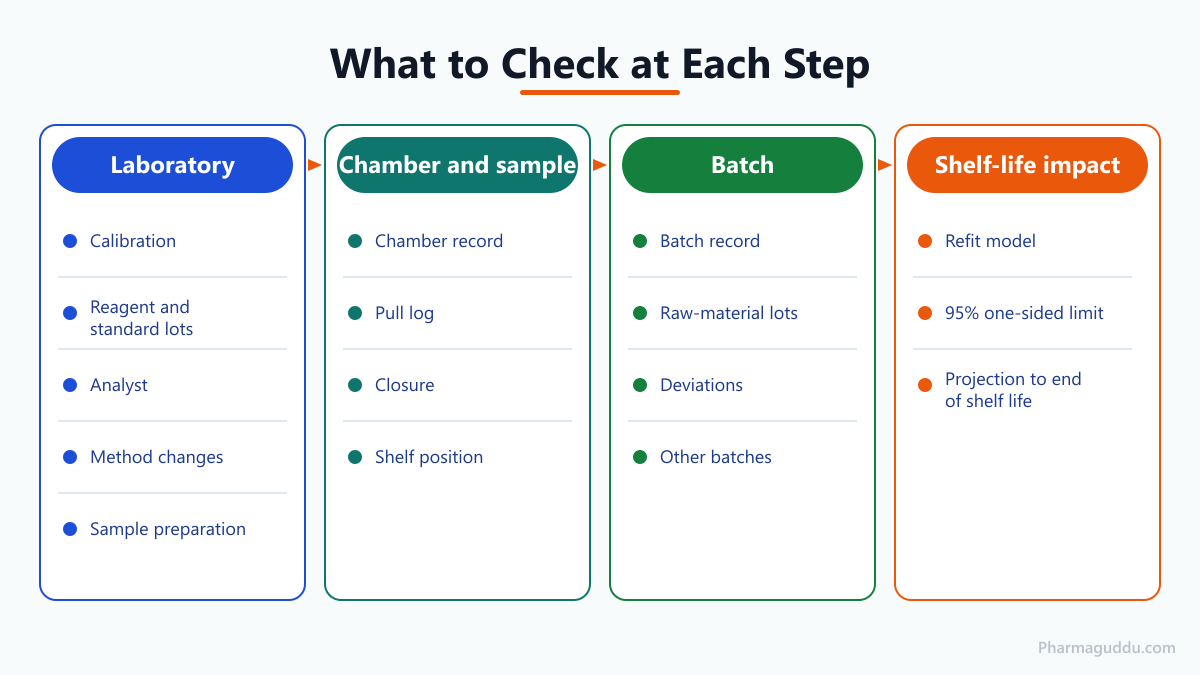
What Do You Check in Each Part of the Investigation?
Confirm the Flag
Purpose: prove the OOT is real before spending lab time.
Function: a second person re-calculates the result from raw data and re-plots the point against the right model.
Common issues: wrong time point on the chart, rounding differences, or a limit copied from another product.
Laboratory Check
Purpose: find an assignable analytical cause.
Function: compare the flagged run with earlier runs. Check system suitability, standard potency, column or apparatus ID, dissolution medium and sample weights.
Common issues: an expired standard, a new column, or a changed analyst. Each attribute has its own usual suspects. Assay and degradants point to standards and columns. Dissolution points to apparatus set-up and medium. Water content points to titrant strength and handling time.
Chamber and Sample Check
Purpose: see if storage or handling shifted the result.
Function: compare the chamber record with the pull date and the shelf position of the sample. A chamber excursion can affect several time points, so also review the sample inventory and pull log for that period.
Common issues: a missed pull, a loose closure, or a sample moved between chambers. According to American Pharmaceutical Review, excursions are judged by duration, size and product sensitivity. Any time limit comes from your own SOP, not a standard.
Reference conditions help here. ICH Q1A(R2) long-term storage is 25 °C ± 2 °C / 60% RH ± 5% RH, or 30 °C ± 2 °C / 65% RH ± 5% RH, and accelerated is 40 °C ± 2 °C / 75% RH ± 5% RH for 6 months.
Batch and Raw-Material Check
Purpose: find a manufacturing cause that is not a lab error.
Function: review the batch manufacturing record, raw-material and packaging lots, and process deviations. Then look at other batches and strengths with the same material or pack.
Common issues: a new API lot, a changed packaging supplier, or a deviation closed as “no impact” without data.
Shelf-Life Impact Check
Purpose: decide if the trend threatens the labelled shelf life.
Function: refit the regression with the new point. ICH Q1E uses the 95% one-sided confidence limit of the mean regression line. Check that it stays inside specification up to the proposed shelf life.
Common issues: pooling batches without a poolability test. Q1E commonly uses a 0.25 significance level for this test.
Worked Example: Assay at 18 Months
This example matches the pillar post. The assay specification is 95–105%. The pooled line is 100.2 − 0.10 × months, so the expected band at 18 months is 97.6–99.2%. The new result is 96.9%.
It passes specification but sits below the band, so it is OOT. A re-check shows no calculation error. The lab review finds no calibration or standard problem. The chamber log is clean. The batch record shows a new API lot. You refit the line with 96.9% included. In this illustration, the refit projection stays inside the 95–105% specification to the end of the proposed shelf life, so no shelf-life change is needed. You document the finding, add the API lot to monitoring and report it in the Annual Product Quality Review (APQR).
How Do You Decide the Outcome?
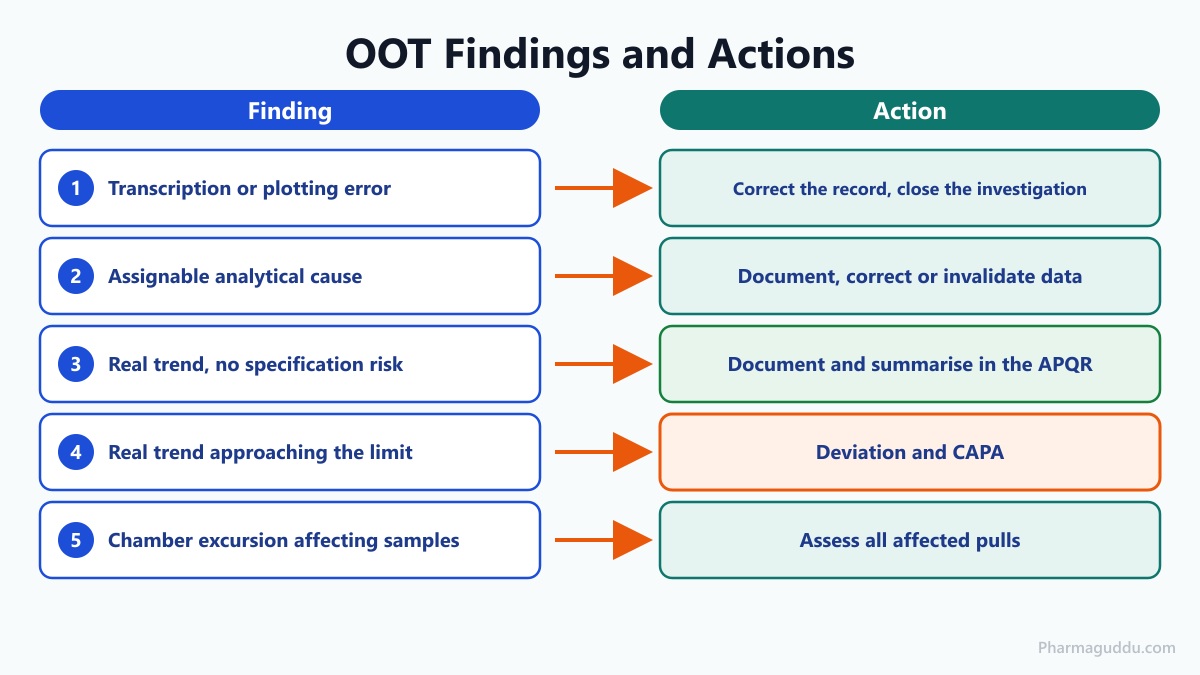
Match what you found to an action. Use this table as a starting point and align it with your SOP.
| Finding | Typical action |
|---|---|
| Transcription or plotting error | Correct the record, close the investigation |
| Assignable analytical cause | Document, correct or invalidate data per SOP, escalate if repeated |
| Real trend, no specification risk | Document and summarise in the APQR |
| Real trend approaching the limit | Raise a deviation and CAPA; review shelf life |
| Chamber excursion affecting samples | Assess all affected pulls; document impact |
Retesting is not a way to remove an inconvenient point. Retest only if your SOP allows it and a lab-error hypothesis exists. Record the original result and the reason. The OOS rule applies here too: retesting alone never cancels a result; you need a proven cause.
Key Parameters to Define in Your SOP
| Item | What to define |
|---|---|
| OOT trigger | Company-defined, for example outside a 95% or 99% prediction or tolerance interval |
| Alert level | Analytical, process-control or compliance alert, with deeper review at each level |
| Timeline | Days to start and close the investigation |
| Retest rule | When allowed, by whom, how many |
| Escalation | Rule for deviation, CAPA and shelf-life review |
Exact values depend on the product and your site. Always follow your SOP. Write the trigger before data are generated, not after.
What Do Regulators Expect?
No regulator sets a numeric OOT limit. Expectations are general.
- EU GMP Chapter 6 (2014): results should be recorded so trends can be evaluated, and OOT and OOS data should be investigated. The chapter also requires an ongoing stability programme.
- 21 CFR 211.166: requires a written stability testing programme with reliable, meaningful and specific methods.
- FDA OOS guidance (May 2022): gives the phased approach for OOS. Companies often reuse the logic for OOT.
- ICH Q1A(R2) and Q1E: storage conditions and regression-based shelf-life evaluation.
The CASRAI guide notes that inspectors criticise “reviewed, no impact” entries with no method, no defined trigger and no record of what was checked.
Recent Technology Trends
- ICH Q1 draft (April 2025): ICH published a Step 2b draft that merges Q1A–F and Q5C. Consultation ran from 30 April to 30 July 2025 (EMA page). It updates statistical evaluation advice. Check ich.org for the final status before changing your SOP.
- LIMS and QMS alerts (2025): Lab Manager describes software that charts regression, flags OOT and opens investigations without manual transcription. Validate it under data-integrity rules.
- AI-assisted analysis (2025): IntuitionLabs lists early AI uses in QC investigations. These are vendor-led, and no regulator endorses an AI method for OOT.
Common Problems and Troubleshooting
Investigation Closed as “No Impact” With No Data
Possible causes: no defined trigger, no template, rushed closure.
Corrective actions: use a report template with method, evidence and shelf-life check. Have QA review it.
Lab Error Assumed Without Proof
Possible causes: pressure to avoid a deviation.
Corrective actions: require evidence such as a failed system suitability check or a calibration lapse. Never drop a point only because it is inconvenient.
Chamber Excursion Blamed Too Fast
Possible causes: a single excursion with no look at other samples.
Corrective actions: compare other products in the same chamber and the same pull dates. A real excursion shifts more than one sample.
Other Batches Ignored
Possible causes: the review stops at the flagged batch.
Corrective actions: check batches that share the API lot, pack or site. See the OOS investigation procedure for a parallel format.
Expert Tips
- Define the trigger first. Write the statistical rule in the SOP before the study starts.
- Keep the original data. Never overwrite the first result; link every retest to a reason.
- Scope the lab check. Review the one attribute and time point, not the whole study.
- Plot the chamber too. Overlay temperature and humidity on the pull date.
- Look sideways. In my experience, when two batches drift the same way, I look at the root cause to prevent recurrence.
- Write for the inspector. Name the method, the evidence and the reviewer.
Frequently Asked Questions
No. The result still meets specification, but it breaks the established pattern. It needs a documented assessment, not an automatic batch hold. If the trend threatens shelf life, the matter moves to a deviation.
Only if your SOP allows it and you have a lab-error hypothesis. Retesting must not remove an inconvenient point. Record the original result, the reason for retesting and the final decision.
No. FDA and EU GMP set no numeric OOT limit. You choose a statistical method, such as a regression tolerance interval, and write the trigger in the SOP before data are generated.
When the trend is real and approaches the specification or threatens shelf life. A transcription error or an isolated analytical cause usually needs only documentation. Repeated analytical causes may still need a CAPA.
No. Judge the size, duration and product sensitivity of the excursion. Then check whether other samples in the same chamber show the same shift. One unaffected product weakens the excursion theory.
Yes. Confirmed trends with no specification risk are normally documented and summarised in the Annual Product Quality Review. Include the cause, the conclusion and any follow-up actions.
Summary
An OOT investigation moves in a fixed order: confirm the flag, check the lab, the chamber and the batch, test shelf-life impact, then document the decision. Define the trigger in your SOP first. Related reading: OOT results in QC.
References
- Investigating OOS Test Results for Pharmaceutical Production – Level 2 revision, US FDA (May 2022)
- ICH Q1 guideline on stability testing of drug substances and drug products, EMA (2025)
- Out-of-trend (OOT) investigation, CASRAI guide
- EudraLex Vol. 4 Chapter 6 Quality Control, European Commission
- Root Cause Analysis in Stability Testing, Adragos Pharma
- How to Investigate Temperature and Humidity Excursions of Stability Chambers, American Pharmaceutical Review
- Modernizing Stability Studies to Drive Speed and Compliance in Lab Testing, Lab Manager
- AI in Pharmaceutical QC: Automating OOS & Batch Release, IntuitionLabs
- ICH Q1A(R2) and Q1E, ICH, 2003; 21 CFR 211.166, US FDA

Pankaj Sharma — Quality Control Specialist
Pankaj Sharma is a pharmaceutical QC professional who reviews our technical content for GMP accuracy, laboratory practices, and regulatory relevance.