
Quality Control Specialist | Industry Experience
✓ Reviewed by: Pankaj Sharma - Quality Control Specialist
Reviewed for Quality Control accuracy, laboratory practices, analytical methods, and technical relevance
📅 Last Updated: October 13, 2026
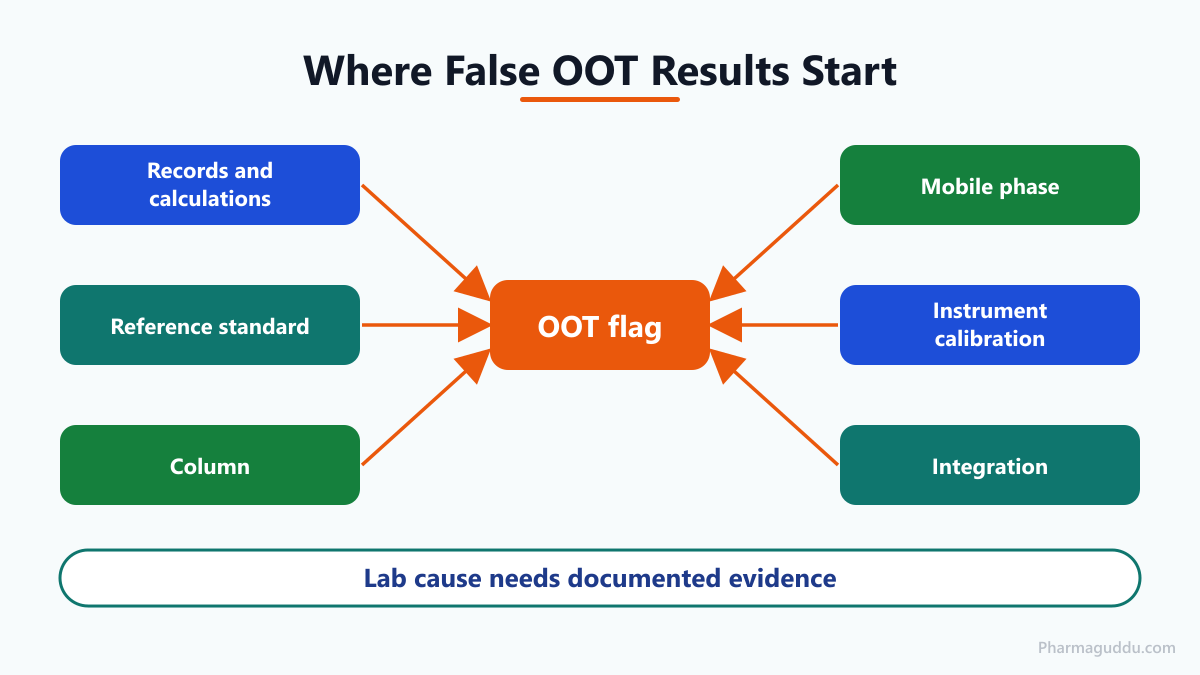
HPLC false OOT results usually come from the laboratory, not from the product. The common causes are wrong weights or calculations, a mis-assigned or degraded reference standard, an ageing or changed column, a mobile phase error, calibration drift and changed integration. Check the records first, then system suitability, then the column, mobile phase and instrument, and write down every finding. Call a result lab-caused only when you hold documented evidence of an assignable cause. If you find none, the result stays valid and is treated as a real trend. Never retest only to pull a result back into the pattern.
What Are HPLC False OOT Results?
A false OOT result is an in-specification HPLC result that looks off-pattern because of a laboratory error, not because the product changed. Out-of-Trend (OOT) means a result that is still within specification but breaks the usual pattern. Out-of-Specification (OOS) means outside the registered limit. Out-of-Expectation (OOE) means atypical against historical data.
For the full overview, see Out of trend (OOT) results in Pharmaceutical Quality control. This article covers only the lab-side checklist. The OOT limit itself is company-defined, so your SOP decides when a flag is raised. How those limits are set is explained in Alert Limit vs Action Limit in OOT Trending.
One point on wording. A flagged result is called an OOT result with a documented assignable laboratory cause. It becomes an “invalid result” only when that cause is proven. Without proof, it stays a valid result.
Which Lab Checks Come First?
Start with the cheapest checks and move to the costly ones. Paper errors take minutes to find. A column swap takes a day. So read the records before you touch the hardware.
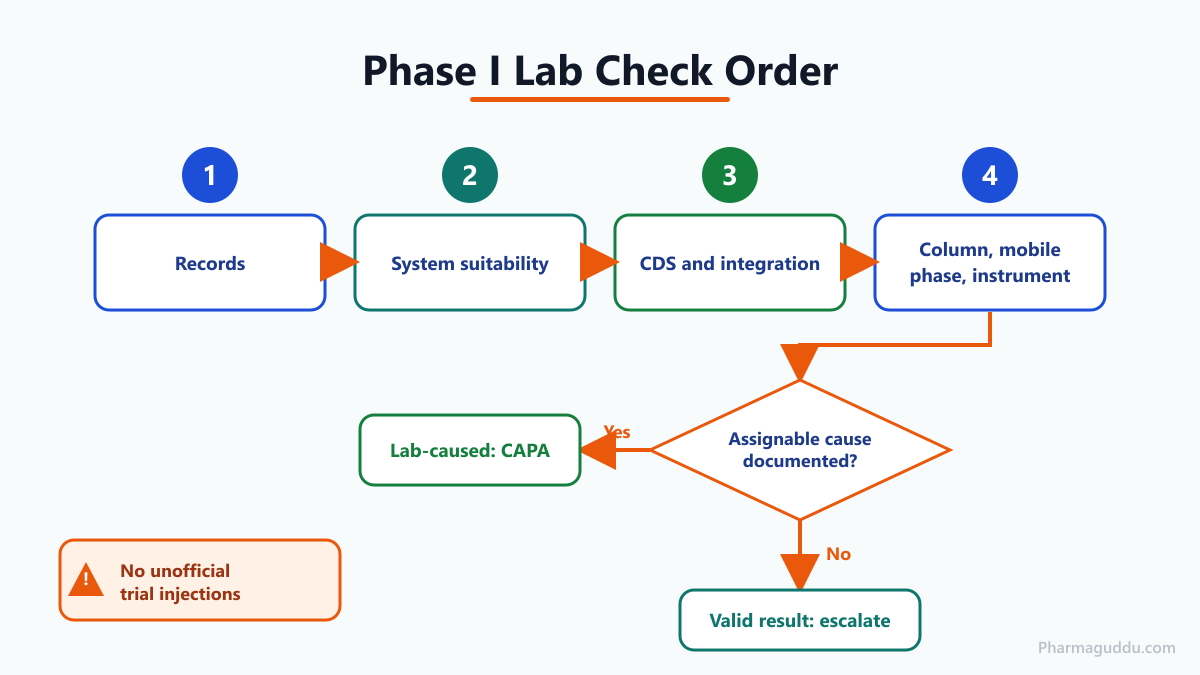
Follow this order, and document each hypothesis and its result:
- Check the records: sample and standard weights, dilution scheme, calculation, and reference standard assignment.
- Review system suitability for the sequence: %RSD, tailing, plates, resolution and signal-to-noise against the method limits.
- Check the CDS: sequence, processing method version and integration events.
- Check the column, mobile phase and instrument.
- If you find an assignable cause, record the evidence and follow the SOP.
- If you find none, stop and escalate. Do not run unofficial trial injections to see if the result “comes back”.
The sequence above is the usual practice, and your site SOP has the final say.
Retesting is not a way to remove an OOT result. Retest only per SOP after a documented laboratory investigation, and never average a new value with the old one. Retest and resample are different things, so do not mix the terms. The decision flow is in How to Investigate an OOT Result in Stability Testing.
How Do Records, Calculations and Reference Standards Create a False OOT?
They create it quietly. One wrong number in the setup shifts every result in a run in the same direction, and that looks exactly like a trend.
Calculation and data-handling errors
Purpose: find mistakes between the balance and the reported result.
Common issues: a wrong potency, dry-basis or water correction in the CDS or spreadsheet; a wrong sample weight; a wrong dilution factor; an uncontrolled spreadsheet version; and a typing error when moving data into the trend file.
Corrective actions: recalculate by hand from raw data, compare with the controlled spreadsheet version, and have a second person verify the entries. Lock calculation templates under version control.
Reference standards and solutions
Use the term reference standard (primary, secondary or working standard) in your records. A wrong potency or water value, an expired or badly stored standard, or a solution used past its stability window biases the whole run. Evaporation or adsorption in stored solutions does the same.
A library CAPA case showed how small this error can be. A working standard label stated moisture of 6.47%, while the certificate of analysis said 6.74%. The fix was a second-person “checked by” step on the label. Record weights, volumes, preparation date and expiry for every solution.
Can an Ageing Column or a New Column Lot Shift Results?
Yes. A column changes slowly, and the change can move assay and impurity results before system suitability fails. Contamination, a partly blocked frit, a void in the packed bed and loss of bonded phase all reduce performance. You may see worse resolution of the critical pair, more tailing, broader peaks, shifting retention, or split peaks.
Keep a column history record with the column ID, injection count and the system suitability values for each use. Trend those values per column, not only as pass or fail. When resolution cannot be restored by regeneration, the column has reached its end of life. Set a life limit in the SOP.
Check the pH range given by the column manufacturer before using a high-pH mobile phase. A different column batch or lot can also cause a sudden step in results, because selectivity differs slightly between lots. More on column types is in Various Types of HPLC Columns.
What Mobile Phase, Instrument and Sample Preparation Errors Cause False OOT?
Mobile phase
Follow the method exactly. Check the organic ratio and whether it is prepared by volume or by weight. Measure buffer pH at the stage the method states. Use fresh buffer, degas properly and keep the reagent grade consistent. In a long sequence, the organic component can evaporate from the reservoir, and retention drifts slowly.
Instrument calibration
System suitability tests the whole method on the day. Instrument calibration or qualification is separate. It covers pump flow, detector wavelength accuracy, injector accuracy and oven temperature. Calibrations drift between due dates, so review HPLC performance records periodically. The site procedure is shown in Calibration of HPLC and their Operation SOP.
Peak areas that vary often point to injection volume, such as an air bubble in the loop or a viscous sample. If every area shifts by the same proportion, check flow and injector, but also recheck weights and dilutions.
Sample preparation
Differences in extraction time, shaking, solvent and filter type change recovery between analysts. Use the filter and technique named in the method, and have the preparation steps written clearly enough that any analyst repeats them the same way.
Why Does Changed Integration Create a Trend?
Because small peaks are sensitive to where the baseline is drawn. Impurity peaks near the quantification limit are most exposed, and noise or a drifting baseline can create an apparent upward trend.
Set integration per method, and use the same integration events at every time point. Compare the OOT chromatogram with earlier ones at the same scale and zoom. A library case recorded that unzoomed prints hid small peaks in related substances.
According to an LCGC article on integration control (2020), manual baseline placement should be limited, and enhancing areas to pass a limit is prohibited. Keep the original and the reintegrated chromatogram, record the scientific reason, and have a second person review it. Reintegrating only to explain an OOT result is a data-integrity risk.
Review the audit trail for missing injections, reprocessing and integration changes. Under ALCOA+ principles, every change must be attributable, so shared logins are not acceptable. Use versioned processing methods so you know which one produced each result.
Why Do Stability Trends Need Extra Care?
A stability trend joins results from many months. If the column, standard lot or analyst changes between time points, the change itself can look like product change. Solution stability matters too, because a sample solution that degrades before injection lowers results.
In our stability lab we noticed a small step in assay after a new working standard lot was introduced; the potency entry in the CDS was wrong, and the correction removed the step.
When the reference standard changes between time points, compare the old and new potency values and the preparation records before you read the trend. Statistical methods are in How to Identify OOT in Stability Studies: Statistical Methods.
Is It a Step Change or a Gradual Drift?
The shape of the trend points to the cause. Look at it before you open the instrument logbook.
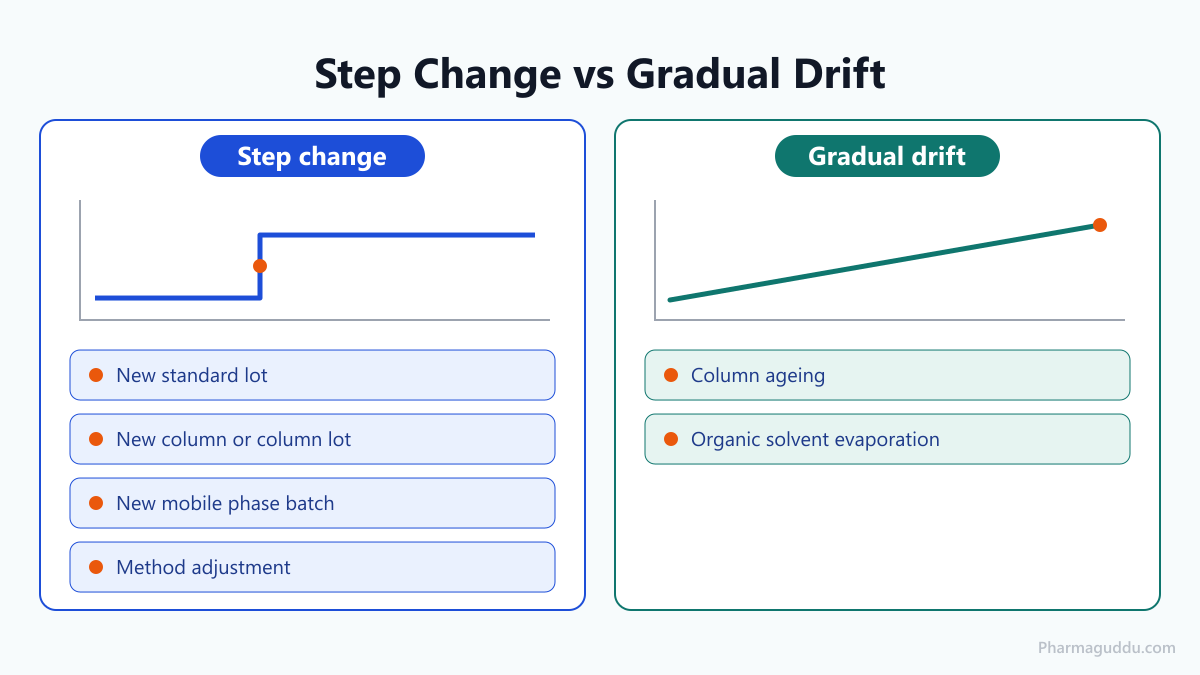
| Pattern | Likely lab cause | First check |
|---|---|---|
| Step change | New standard lot | Potency and water correction on the new lot |
| Step change | New column or column lot | Column ID and lot against the history record |
| Step change | New mobile phase batch | Preparation record and pH |
| Step change | Method adjustment | Change record against the allowed adjustments |
| Gradual drift | Column ageing | System suitability values per column |
| Gradual drift | Organic solvent evaporation | Reservoir cap, sequence length |
What Do the Regulations and Standards Expect?
The FDA guidance “Investigating Out-of-Specification (OOS) Test Results for Pharmaceutical Production” (Level 2 revision, May 2022) covers OOS results, not OOT. Many sites apply its laboratory-investigation logic to OOT in their own SOPs, and that is a site decision, not FDA text.
For US sites, 21 CFR 211.160 covers laboratory controls and 21 CFR 211.194 covers laboratory records. For the CDS, EU GMP Annex 11 (2011) sets audit trail and data-integrity expectations. FDA’s Data Integrity Q&A (December 2018) deals with complete data.
Compendial methods are verified; in-house methods are validated. USP <621>, harmonized with Ph. Eur. 2.2.46, allows defined adjustments without revalidation if system suitability is still met. Any unrecorded adjustment can explain a step change.
Recent Technology Trends
Three developments touch this topic.
- Harmonized chromatography chapters (2022–2023): according to Crawford Scientific (2023), USP <621> became official on 1 December 2022 and the Ph. Eur., BP and JP chapters followed in January 2023. Check whether a method adjustment lines up with a step change.
- USP <621> system suitability sections (2025): LCGC (2024) reports that the system sensitivity and peak symmetry sections became official on 1 May 2025. A changed calculation can change pass or fail behaviour, so compare your SOPs and CDS reports. A later revision was reported but is not confirmed.
- Automated integration (2025–2026): vendors now offer AI-assisted peak integration, and LCGC’s HPLC 2026 report describes it as mostly at research stage. Any such tool needs validation and audit-trail control before GMP use.
Common Problems and Troubleshooting
| Symptom | Likely cause | Corrective action |
|---|---|---|
| All results in a run shift the same way | Wrong standard potency, weight or dilution | Recheck records and calculations |
| Results drift upward over weeks | Column ageing or contamination | Review system suitability per column; replace column |
| Small impurity peaks vary | Baseline noise, changed integration | Compare chromatograms at same zoom; review audit trail |
| Retention time moves | Mobile phase composition, temperature, evaporation | Prepare fresh phase; check oven |
| Areas vary at random | Injection volume, bubble, adsorption | Purge system; check injector |
| Step change after a new item | New standard, column lot or batch | Check records of the change |
Retention drift is often linked to column temperature control or mobile phase composition. If the void-volume disturbance overlays but the analyte moves, suspect composition, temperature or selectivity rather than flow. This is general chromatographic practice.
What Corrective and Preventive Actions Follow a Confirmed Lab Cause?
Record the cause, then fix the system and not only the single result. Typical actions are analyst retraining, an SOP revision, a second-person label check on working standards, column life limits, controlled spreadsheet templates and a CAPA with an effectiveness check. If no cause is found, the result stays valid and goes to the wider investigation.
Frequently Asked Questions
Yes, when peak shape, resolution or retention change enough to affect integration or co-elution. System suitability values trended per column usually show the change first, before assay results move. Keep a column history record with injection counts.
Only under an SOP, with a scientific reason, kept original data, second-person review and a reviewed audit trail. Reintegrating only to move a result toward the pattern is a data-integrity problem. Shaving or enhancing areas to pass a limit is prohibited.
Only per SOP after a documented laboratory investigation. Retesting must not be used to average away a result. Retest and resample are different actions, and an unexplained OOT stays valid. Follow your site procedure and involve QA.
A wrong potency or water correction, expiry, poor storage or an expired solution biases a whole run in one direction. If the standard changes between time points, the trend can show a step. Check the label against the certificate.
No. The FDA guidance, Level 2 revision of May 2022, covers out-of-specification results. Many sites apply its laboratory-investigation logic to OOT, but that is a site SOP decision. No numeric OOT limit comes from it.
Summary
Most false OOT flags start in the lab. Check records and calculations, then system suitability, column, mobile phase and instrument, and look for integration changes. Claim a lab cause only with documented proof. Without proof, the result is valid and a real trend, so escalate and never retest it away.
References
- Are You Sure You Understand USP <621>?, LCGC / Chromatography Online
- Allowable changes to chromatography methods for HPLC, Crawford Scientific
- Are You Controlling Peak Integration to Ensure Data Integrity?, LCGC / Chromatography Online
- Investigating OOS Test Results for Pharmaceutical Production – Level 2 revision, US FDA
- Data Integrity and Compliance With Drug CGMP: Questions and Answers, US FDA
- EudraLex Volume 4, European Commission
- How AI and ML are reshaping separations science at HPLC 2026, LCGC / Chromatography Online
- Peak Area Fluctuations, Shimadzu
- Troubleshooting Retention Time Changes in (U)HPLC, Chromatography Today
- Snyder, Kirkland, Dolan, Introduction to Modern Liquid Chromatography, Wiley

Pankaj Sharma — Quality Control Specialist
Pankaj Sharma is a pharmaceutical QC professional who reviews our technical content for GMP accuracy, laboratory practices, and regulatory relevance.