
Quality Assurance & Regulatory Specialist
✓ Reviewed by: Pankaj Sharma - Quality Control Specialist
Reviewed for Quality Control accuracy, laboratory practices, analytical methods, and technical relevance
📅 Last Updated: October 15, 2026
An annual product review (APR / PQR) is a yearly, documented look back at the quality records of each medicine you make. You collect batch, test, stability, complaint, deviation and change data, trend it, and decide whether the process is still in control. In the US the duty comes from 21 CFR 211.180(e). In the EU it is the product quality review in Chapter 1 of the GMP Guide. A good review ends with clear conclusions and actions, such as CAPA, a specification change or revalidation, all tracked until closed. A pile of data without conclusions does not do the job.
What Is an Annual Product Review (APR / PQR)?
An annual product review is a written evaluation of a full year of quality data for one product. It checks that the process stays consistent, that specifications still fit, and that improvements are not missed. Think of it as a yearly health check: each batch result is one temperature reading, and the APR is the doctor’s summary of the whole year.
Definition: An APR is a structured, documented review of batch and quality-system data for a defined period, ending in conclusions and tracked actions.
The names differ by region. APR is the US term from 21 CFR 211.180(e). PQR (Product Quality Review) is the EU term from Chapter 1 of EudraLex Volume 4. APQR is the industry name for one combined review. They are close but not exact synonyms: scope and wording differ slightly, and the EU review is periodic or rolling, not locked to a calendar year.
How Does an APR Work?
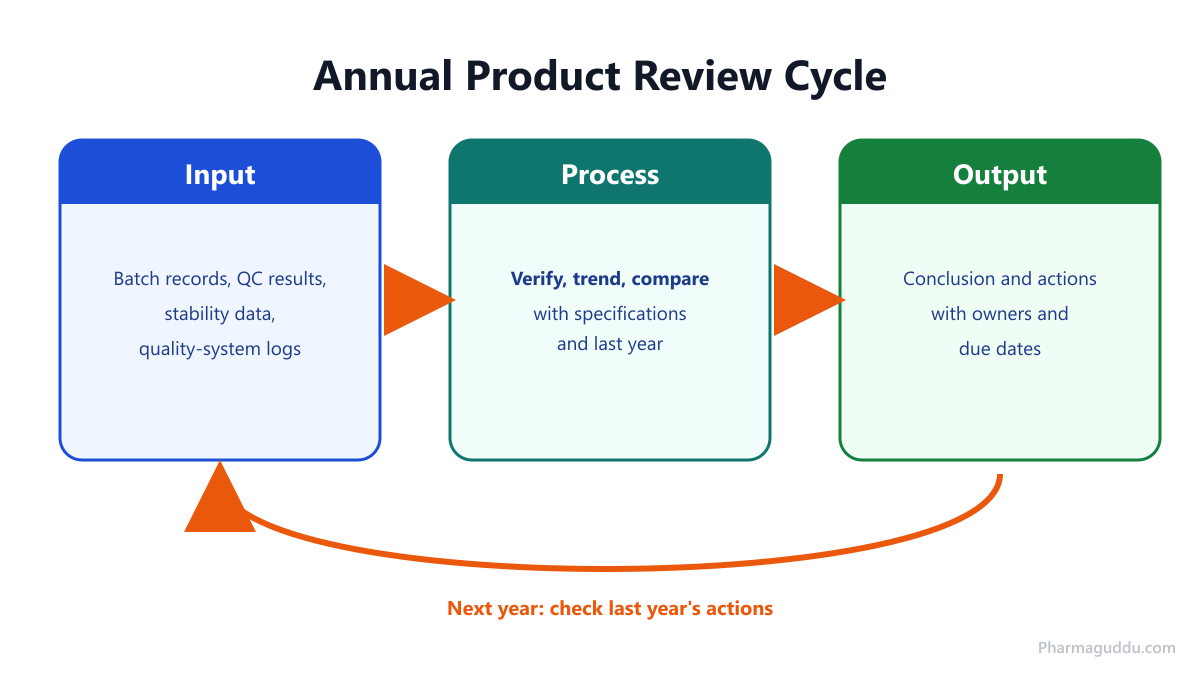
An APR works as a loop. You collect a year of data, trend it, draw conclusions, act, and then check next year whether your actions worked.
- Input: batch records, QC results, stability data and quality-system logs (deviations, changes, complaints).
- Process: verify the data, trend it, and compare it with specifications and last year’s review.
- Output: a conclusion on the state of control, plus recommendations with Team and due dates.
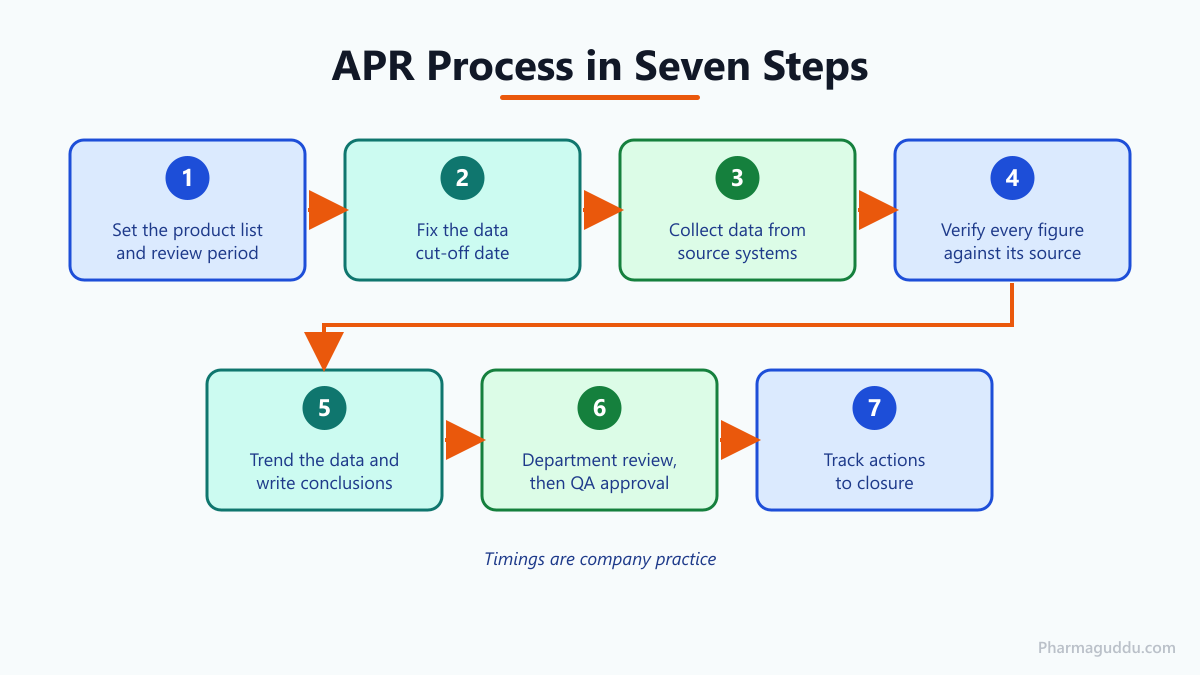
The usual sequence is below. The timings are company practice, not regulatory numbers.
- Set the product list and review period. Include every product, strength and pack, including export-only and contract-manufactured products.
- Fix the data cut-off date, normally the last day of the review period. Later data goes into next year’s review.
- Collect data from source systems such as batch records, the laboratory system, the stability programme and the quality-system logs. As an illustrative proposal, allow one to two months.
- Verify every figure against its source record.
- Trend the data and write conclusions for each section.
- Send the draft for department review (Production, QC, engineering, regulatory affairs), then to QA for approval. Many sites aim to finish within a few months of the cut-off; your SOP sets the exact window.
- Track actions to closure, and check them again in the next review.
What Should an APR Cover?
Section 1.10 of EU Chapter 1 lists twelve items the review should include at least. They run from starting materials and in-process controls to stability, complaints, qualification status and contract arrangements. The US rule in 21 CFR 211.180(e) is shorter, so most sites build one combined review that covers both. The table turns these lists into a practical checklist. Sources and owners are typical; yours may differ.
| Review element | Example source | Usual owner |
|---|---|---|
| Batches made, approved and rejected | Batch records, ERP | Production, QA |
| Starting and packaging material quality, new sources | Material and vendor records | QC, QA |
| Critical in-process and finished-product results | Laboratory system | QC |
| Deviations and their CAPA | Deviation and CAPA log | QA |
| Changes to process, methods, equipment | Change control log | QA |
| Marketing authorisation variations, post-approval commitments | Regulatory files | Regulatory affairs |
| Stability results and trends | Stability reports | QC |
| Complaints, recalls, returns, salvaged product | Complaint and recall log | QA |
| Qualification and validation status, calibration | Validation and calibration records | Engineering, validation |
| Contract and technical agreements | Agreement files | QA |
| Actions from the previous APR | Last APR, CAPA system | QA |
Keep two things apart: a deviation is unplanned, while a change is planned. Review each in its own section, because they point to different weaknesses. Pull complaint and recall data from the log kept under your recall and complaints procedure. For non-sterile products, add microbial results; see microbial testing of non-sterile products.
Read more: APR data checklist by source system
How Do You Trend APR Data and Reach a Conclusion?
You plot each key result batch by batch, compare it with limits and last year, and then state in writing whether the process is in control and capable.
- Choose what to trend: critical quality attributes such as assay, dissolution, impurities and content uniformity; yield; and critical process parameters.
- Use control charts with alert and action limits. An alert limit triggers a look. An action limit triggers a formal investigation.
- Watch for Out-of-Trend (OOT) results. An OOT result is still within specification but breaks the usual pattern. Count OOS and OOT events per year.
- Calculate capability indices such as Cpk (short-term) or Ppk (long-term). They show how much room the process has inside the specification. Set the target in your SOP and justify it.
Assay data needs care, because assay and potency are related but not identical; this post on drug product assay and potency explains the difference.
Then write the conclusion. Say whether the process is in a state of control, whether it is capable, and whether process revalidation is needed. Use the right word: a process or computerised system is validated, while equipment is qualified. An equipment trend leads to requalification, not revalidation.
On most sites I’ve worked with, the trending section is the one that gets rushed. A chart with no comment is only a picture.
Read more: trend analysis in an APR with control charts and Cpk
How Do APR Results Link to CAPA, Change Control and Revalidation?
An APR only helps if it triggers action. EU Chapter 1, section 1.11 says the manufacturer and, where different, the marketing authorisation holder should assess whether CAPA or revalidation is needed. It also asks for procedures to manage these actions and review them, with their effectiveness verified during self-inspection.
Start every APR with last year’s recommendations. List each one with its owner, due date, status and evidence. Close a CAPA only after the effectiveness check, not when the action is merely finished. Section 1.10 also asks you to review how effective the CAPA from significant deviations was.
Route any specification, method or process change through change control. Some change control forms carry a tick-box such as ‘To be reported in APR’. Pull that tick-box into your SOP flow, so QA logs each flagged change when it closes and nothing is missed at year end. Our change control system SOP shows the full flow. For adverse trends, follow a structured root cause method, like this product investigation and root cause analysis example.
Read more: linking APR to CAPA, change control and revalidation
What Do the Regulations Require?
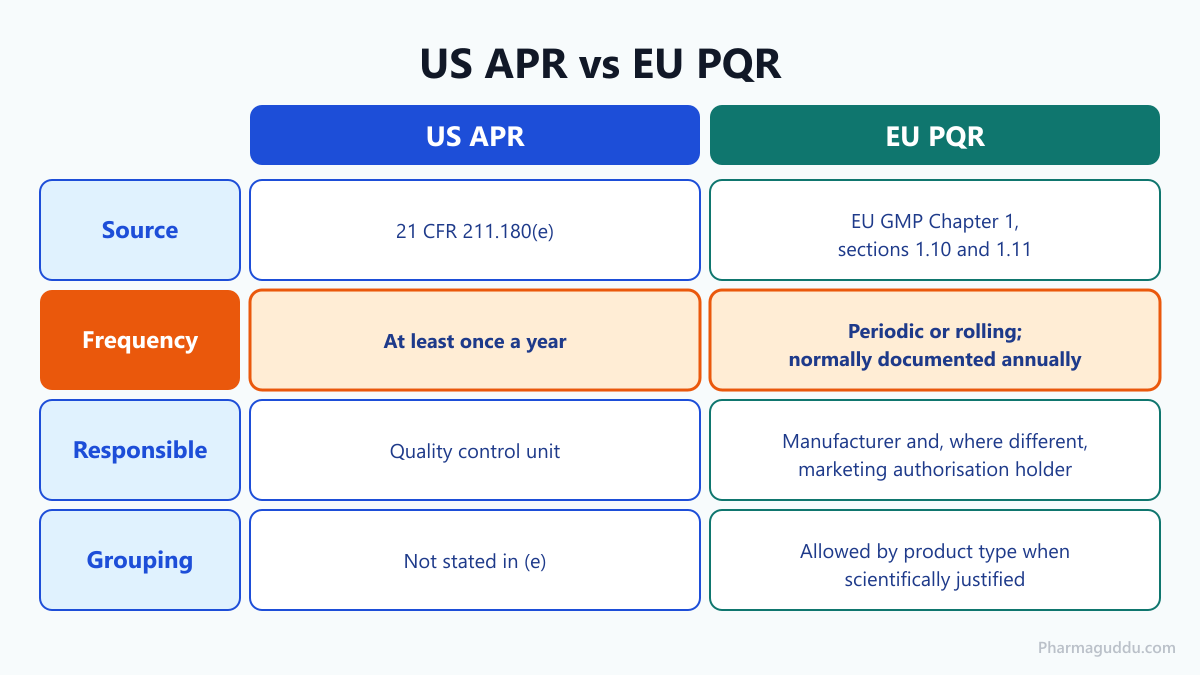
The US, EU and API rules ask for the same core thing: a regular, documented review that leads to decisions.
21 CFR 211.180(e) requires records to be kept so that, at least once a year, you can evaluate the quality standards of each drug product and decide whether specifications or manufacturing or control procedures need to change. Written procedures for this evaluation must be established and followed. Paragraph (e)(1) covers a representative number of batches, approved or rejected, with related batch records where applicable. Paragraph (e)(2) covers complaints, recalls, returned or salvaged drug products and investigations under 211.192.
EudraLex Volume 4, Chapter 1 (revision 3, in operation from 31 January 2013), section 1.10, asks for regular periodic or rolling quality reviews of all authorised medicinal products, including export-only products. The aims are to verify process consistency, check that specifications are still appropriate, highlight trends and find improvements. Such reviews should normally be conducted and documented annually, taking previous reviews into account.
ICH Q7 asks for regular quality reviews of active pharmaceutical ingredients (APIs). PIC/S states that it keeps its GMP Guide (PE 009) harmonised with the EU Guide under its co-operation agreement with the European Medicines Agency (PIC/S news, September 2026). WHO GMP texts and India’s revised Schedule M (Part I, section 2.3), WHO GMP guidance (TRS 986, Annex 2, “Product quality review”), and the PIC/S GMP Guide (Part I, Chapter 1, section 1.10) describe periodic review intended to assess process consistency, product specifications and quality trends, with reviews normally documented annually.
| Point | US APR | EU PQR |
|---|---|---|
| Source | 21 CFR 211.180(e) | EU GMP Chapter 1, sections 1.10 and 1.11 |
| Frequency | At least once a year | Periodic or rolling; normally documented annually |
| Scope | Batches, complaints, recalls, returns, investigations | Twelve listed items, including stability, variations and equipment qualification |
| Responsible | Quality control unit (21 CFR 211.22) | Manufacturer and, where different, marketing authorisation holder |
| Grouping | Not stated in (e) | Allowed by product type when scientifically justified |
Read more: APR vs PQR differences and PQR requirements in India, WHO and PIC/S
Who Owns the APR, and What About Contract Manufacturing?
QA normally owns, coordinates and approves the APR. Production, QC, engineering, validation and regulatory affairs supply data and comments. The sign-off level, often the head of QA, is set by your SOP.
Do not mix up the roles. In the US, the quality control unit approves or rejects products and reviews records. In the EU, the Qualified Person certifies each batch; that is the QP’s main role, not ownership of the PQR.
With contract manufacturing, the duties split. Section 1.11 says that where the marketing authorisation holder is not the manufacturer, a technical agreement should define each party’s responsibilities for the review. In practice, the agreement should name who collects data, who writes, who approves, the deadlines, and who tracks CAPA.
How Do You Handle Products With Few or No Batches?
Still review them. A product with few batches has less data, but its complaints, stability, changes and regulatory status carry on.
The 2013 text allows quality reviews to be grouped by product type, such as solid or liquid dosage forms, when scientifically justified. The September 2025 draft revision of Chapter 1 says it clarifies the review for product grouping and for periods with only a limited number of batches (European Commission consultation page). It is a draft, so treat what follows as a proposal for your SOP, not a requirement:
- State plainly that few or no batches were made, and why.
- Still review stability, complaints, recalls, returns, deviations, changes and regulatory variations.
- Add the previous APR’s trends so the picture is not lost.
- Say that statistical trending has limited power with few batches.
Read more: APR for few-batch, no-batch and grouped products
How Do You Protect Data Integrity in an APR?
Treat the APR like any other GMP record. Apply ALCOA+: data must be Attributable, Legible, Contemporaneous, Original and Accurate, plus Complete, Consistent, Enduring and Available.
Verify numbers against the source, such as the laboratory system and batch records, and cite the source ID beside each table. Control your spreadsheets: lock formulas, keep version control, and validate them for their use. If you use an electronic APR tool, it is a computerised system, so it must be validated and meet 21 CFR Part 11 and EU Annex 11 expectations, including an audit trail. I’ve seen a single wrong cell reference quietly change a whole year of averages, so check the check.
Read more: data integrity and e-APR tools
What Are the Benefits and Limits of an APR?
Benefits:
- Spots slow drifts before they become OOS results.
- Confirms that specifications and procedures still fit.
- Gives you a clear picture of CAPA and change status.
- Builds inspection-ready evidence of control.
Limits:
- It looks backward, so it is not a real-time control.
- Weak source data gives weak conclusions.
- Few batches mean limited statistics.
- Without follow-up, it becomes paperwork.
Recent Technology Trends
Three developments matter for your APR SOP.
- 3 September 2025, European Commission and PIC/S: a joint consultation opened on a revised Chapter 1 (Pharmaceutical Quality System), running to 3 December 2025. The draft aligns with ICH Q9(R1), strengthens knowledge management, and clarifies the product quality review for product grouping and limited-batch periods. The EC page now lists the consultation as closed. The sources checked for this article show no final text or effective date, so work to the current 2013 text and watch the EC EudraLex Volume 4 page.
- 30 July 2026, PIC/S: published the revised Recommendations on Qualification and Validation (PI 006-4), in force from 1 October 2026. It supersedes PI 006-3. Because your APR reports qualification and validation status, check that your wording matches the document your inspectors will use.
- 2025 onward, software vendors: they market electronic APQR tools that pull data from laboratory, manufacturing, ERP and quality systems and draft the report. One example is a 2025 article by the vendor Azilen. These are vendor claims, not regulatory positions. Any such tool needs validation, Part 11 and Annex 11 controls, an audit trail, and a human review of the conclusions.
Common Problems and Troubleshooting
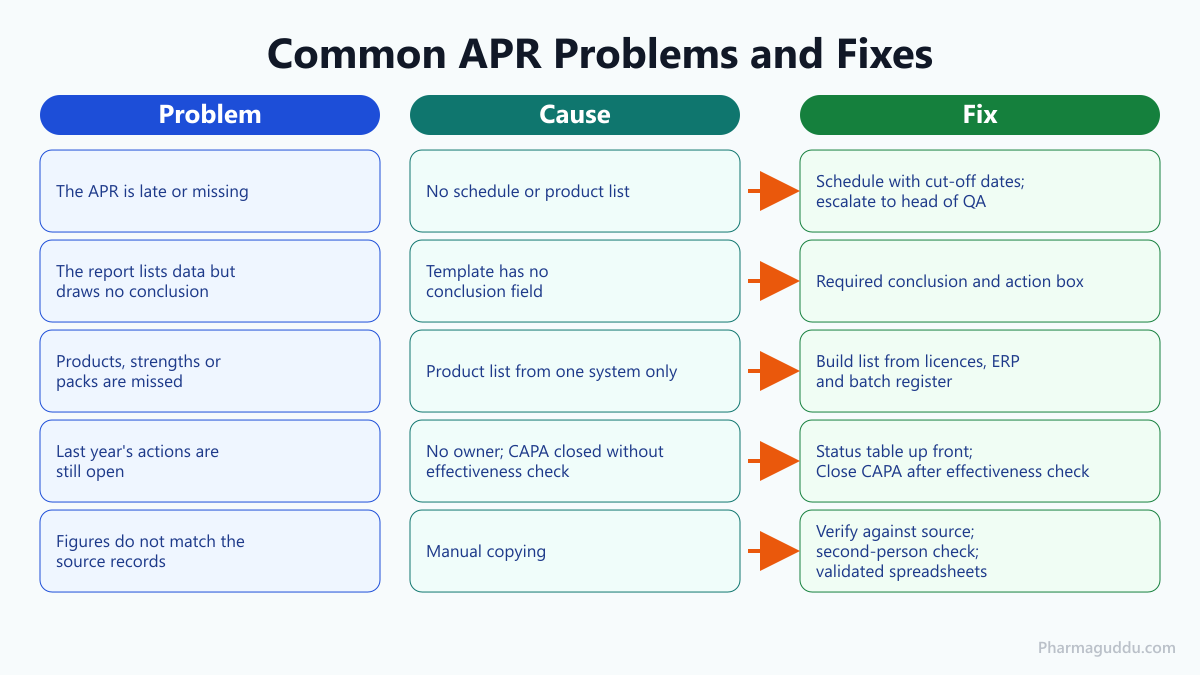
These are patterns I see often when reviewing APRs. They are practice observations, not inspection statistics.
The APR Is Late or Missing
Possible causes:
- No APR schedule or product list.
- Data owners treat the request as low priority.
Corrective actions:
- Publish an APR schedule with a data cut-off date for each product.
- Track progress monthly and escalate delays to the head of QA.
The Report Lists Data but Draws No Conclusion
Possible causes:
- The template has tables but no conclusion field.
- Reviewers are short of time.
Corrective actions:
- Add a required ‘conclusion and action’ box to every section.
- Reject drafts where a chart has no comment.
Products, Strengths or Packs Are Missed
Possible causes:
- The product list comes from one system only.
- New or rarely made products are forgotten.
Corrective actions:
- Build the list from licences, the ERP and the batch register.
- Include no-batch and contract products with a stated reason.
Last Year’s Actions Are Still Open
Possible causes:
- Actions have no owner or due date.
- CAPA is closed on completion, with no effectiveness check.
Corrective actions:
- Open the report with a status table of last year’s actions.
- Close CAPA only after the effectiveness check.
Figures Do Not Match the Source Records
Possible causes:
- Manual copying into spreadsheets.
- Late result corrections not updated.
Corrective actions:
- Verify each figure against its source and have a second person check.
- Use controlled, validated spreadsheets or a validated tool.
Expert Tips
Start before the year ends. Agree the schedule and data owners in advance, not after the cut-off.
Write the conclusion first. For each section, answer three questions: what did we see, is it acceptable, and what next?
Catch changes as they close. Use the ‘to be reported in APR’ tick-box so QA logs each flagged change straight away.
Use one template every year. A fixed layout makes year-on-year comparison easy.
Show the batch count. State how many batches each chart covers, so readers can judge the trend.
Get a second pair of eyes. An independent check of calculations and transcribed values saves embarrassment.
Put open actions up front. If last year’s actions are visible on page one, they get closed.
Frequently Asked Questions
For finished medicines, yes. 21 CFR 211.180(e) covers each drug product, and EU Chapter 1, section 1.10 covers all authorised medicinal products, including export-only ones. For active pharmaceutical ingredients, ICH Q7 asks for regular quality reviews. Include every product, strength and pack in your APR schedule, even products made rarely.
QA normally coordinates and approves the APR, while Production, QC, engineering, validation and regulatory affairs supply data and comments. The exact sign-off, often the head of QA, is set by your SOP. In the EU, section 1.11 places the evaluation on the manufacturer and, where different, the marketing authorisation holder.
The US rule says a representative number of batches, approved or rejected. The EU text asks you to review critical in-process and finished-product results and all batches that failed specification. In practice, most sites review every batch made in the period, because it is easier to defend. If you sample, document why the sample is representative.
An APR looks at one product’s data over a period. A management review looks at the whole pharmaceutical quality system; EU Chapter 1, section 1.6 asks for periodic management review involving senior management. APR conclusions, such as adverse trends and open CAPA, are a natural input to that review, but the two are separate documents.
Yes, where it is scientifically justified. EU Chapter 1, section 1.11 allows quality reviews to be grouped by product type, for example solid or liquid dosage forms. The 2025 draft revision says it clarifies product grouping. Write down the justification, and keep each product’s and strength’s data visible so a trend in one cannot hide inside the group.
Summary
An annual product review (APR / PQR) turns a year of data into decisions. Cover every product, trend the key results, verify figures against source, and write a conclusion for each section. Link findings to CAPA, change control and revalidation, and track every action until the effectiveness check is done. The US rule is 21 CFR 211.180(e); the EU rule is Chapter 1, sections 1.10 and 1.11. Keep an eye on the Chapter 1 revision.
References
- 21 CFR 211.180 General requirements (records and reports), eCFR
- 21 CFR 211.180, Cornell Legal Information Institute
- EudraLex Volume 4, Chapter 1 Pharmaceutical Quality System (revision 3, in operation 31 January 2013), European Commission
- Stakeholders consultation EudraLex Volume 4 Chapter 1, European Commission, September 2025
- Joint stakeholders consultation on the revision of Chapter 1, and 2026 PIC/S news (PE 009-18, PI 006-4), PIC/S
- APQR AI/automation article, Azilen (vendor material)
- ICH Q7, Good Manufacturing Practice Guide for Active Pharmaceutical Ingredients, ICH
- ICH Q9(R1), Quality Risk Management, ICH
- 21 CFR Part 11 (electronic records) and EU GMP Annex 11 (computerised systems)

Satpal Singh — Quality Assurance & Regulatory Specialist
Satpal Singh is an experienced pharmaceutical Quality Assurance and Regulatory professional with expertise in GMP compliance, quality systems, technical documentation, and regulatory requirements. He reviews our pharmaceutical content to ensure accuracy, industry relevance, and alignment with current quality and regulatory standards.
Expertise: QA Systems | GMP Compliance | Regulatory Documentation | Audits | Quality Management