
Quality Control Specialist | Industry Experience
✓ Reviewed by: Pankaj Sharma - Quality Control Specialist
Reviewed for Quality Control accuracy, laboratory practices, analytical methods, and technical relevance
📅 Last Updated: October 17, 2026
Trend analysis in an APR with control charts and Cpk means plotting batch results in time order, checking that the process is stable, and then measuring how much room the results have inside the specification. Use an individuals and moving range (I-MR) chart when you have one result per batch. Calculate Cpk only after the chart shows a stable process, and always state how many batches sit behind the figure. Many sites use Cpk ≥ 1.33 as a minimum, but that is a company convention, not a regulatory limit. Any signal needs a documented evaluation and a CAPA or a justified no-action.
What Is Trend Analysis in an APR with Control Charts and Cpk?
It is the part of the annual product review where you turn a year of batch numbers into a picture of how the process behaves. A control chart shows whether the process is stable. Cpk shows how comfortably the stable process fits inside its specification.
For the full overview, see Annual Product Review (APR / PQR). This article covers only the trending step. APR is the US term and PQR is the EU term; in both cases the quality unit reviews and approves the report.
Cpk is a process capability index. It compares the distance from the process mean to the nearest specification limit against three standard deviations.
Which Data Should You Trend in an APR?
Trend the attributes that describe product quality and process health: assay, dissolution, impurities, content uniformity, yield, critical in-process controls (IPCs) and stability results. Plot them batch by batch in manufacturing order, not in testing order.
Include every batch in the review period, including rejected and reworked ones. Leaving out a failed batch makes the process look better than it is. According to EudraLex Vol 4 Chapter 1 (2013), section 1.10 asks for a review of critical in-process controls and finished product results, and of all batches that failed specification.
Pull the numbers from the source systems, and use the APR data checklist by source system to prove the data set is complete.
Which Control Chart Should You Use?
Use an I-MR chart when each batch gives one value. The individuals chart plots the values, and the moving range chart plots the difference between consecutive batches. Use an X-bar/R chart only when you have real subgroups, such as several tablets tested from each batch.
Most APR data are single values per batch, so I-MR is the usual choice. Estimate sigma from the moving range, not from the overall standard deviation. Otherwise a drifting process inflates its own limits.
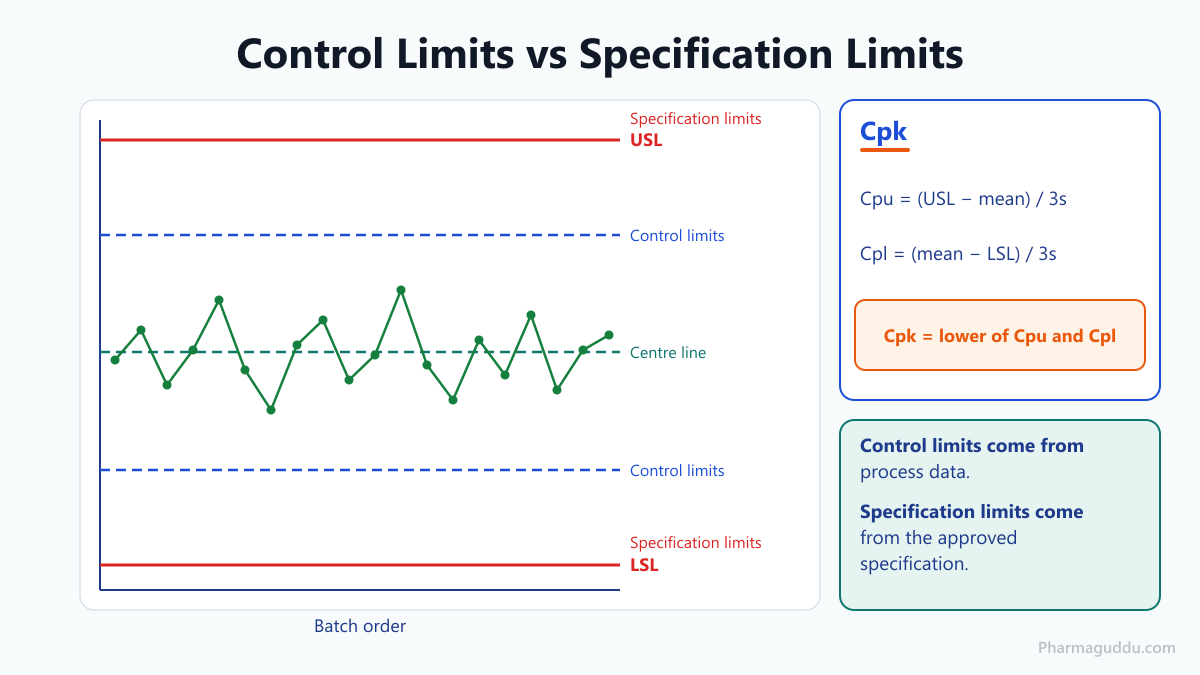
Control limits sit at the centre line ± 3 sigma. Run rules add early warning; a common set flags eight points in a row on one side of the centre line, or two of three points beyond 2 sigma. Your SOP chooses the rule set, because every extra rule raises the false-alarm rate.
How Do You Calculate Cpk?
Calculate two one-sided indices and report the smaller one:
- Cpu = (USL − mean) / (3 × standard deviation)
- Cpl = (mean − LSL) / (3 × standard deviation)
- Cpk = the lower of Cpu and Cpl
USL and LSL are the upper and lower specification limits. PIC/S PI 006-3 (2007) describes Cpk in the same way and lists process capability studies and control charts among the sources of historical process data.
The FDA-hosted case study by Lynn Torbeck gives a worked example. The table shows its numbers.
| Item | Value |
|---|---|
| Lower specification limit (LSL) | 95.0 |
| Upper specification limit (USL) | 105 |
| Process mean | 99.68 |
| Standard deviation | 1.413 |
| Cpu | 1.3 |
| Cpl | 1.1 |
| Cpk (the lower value) | 1.1 |
The mean sits below the centre of 100, so the lower side limits the index. The case study states that Cpk of 1.0 or less means the process is not capable, and it suggests Cpk above 1.33. Its recommendation was to start a CAPA for operator differences and then to centre the process at 100.
Cpk or Ppk?
Cpk uses within-subgroup (short-term) sigma. Ppk uses the overall sigma of all data. For a year of batches with shifts between them, Ppk is usually the more honest figure. State in the APR which one you report and how sigma was estimated.
How Reliable Is a Cpk Value?
Less reliable than it looks. Cpk does not account for sample size, according to the FDA-hosted case study. A Cpk of 1.5 from eight batches means far less than 1.5 from eighty.
Do two things. First, report the number of batches next to every Cpk. Second, calculate a lower confidence bound for Cpk and compare that with your target. The same case study prefers statistical tolerance intervals, which include sample size. For its 307 results, the 99%/99% interval was 95.5 to 103.8.
Three situations need extra care:
- Non-normal data. Cpk assumes roughly bell-shaped data. If the histogram is clearly skewed, ask a statistician and write the chosen method in the SOP.
- One-sided specifications. Impurities often have only an upper limit. Report only the relevant index (Cpu), not a Cpk with a limit that does not exist.
- Results below the limit of quantitation (LOQ). Do not replace them with invented numbers without a rule. Define the treatment in the SOP and state it in the report.
What Is the Difference Between Control Limits and Specification Limits?
Control limits come from your process data. Specification limits come from the approved specification. They answer different questions, and mixing them up is one of the most common errors in APR reports.
| Feature | Control limits | Specification limits |
|---|---|---|
| Source | Process data (centre ± 3 sigma) | Approved specification |
| Answers | Is the process stable? | Does the product comply? |
| Changes when | Process behaviour changes | Specification is formally revised |
| A point outside means | Possible special cause | Out of specification (OOS) |
A process can sit inside specification yet be unstable. The case study calls this “meets specifications for now but is not statistically stable or predictable.” In practice, that is the situation a good APR chart exposes before a batch fails.
How Do You Trend Data Step by Step?
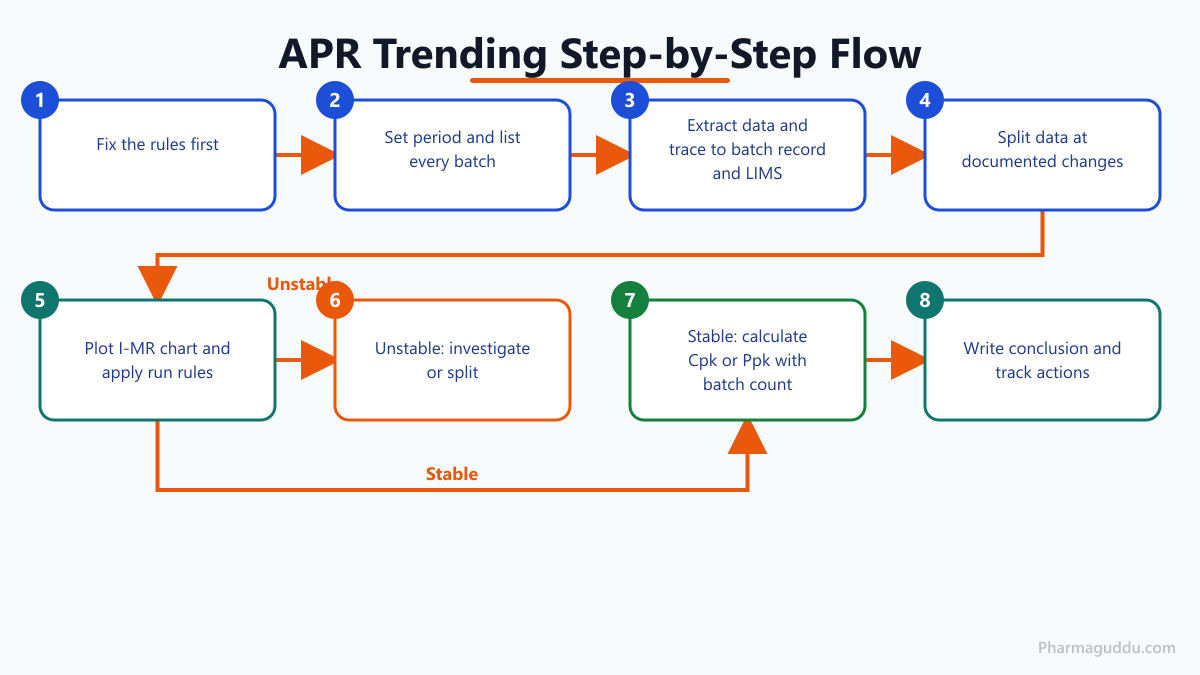
- Fix the rules first. Write the chart type, run rules, alert/action limits and Cpk target in an SOP before you look at the data. Never change them to fit the result.
- Set the review period and list every batch, including rejected ones.
- Extract the results from the source systems and trace each point to its batch record and LIMS entry.
- Split the data at any documented change, such as new equipment, method, supplier or site. Compare the before and after periods.
- Plot the I-MR chart and apply the run rules.
- If the chart is unstable, investigate or split the data and explain this. Do not quote Cpk for an unstable process.
- If the chart is stable, check the shape of the data, then calculate Cpk or Ppk with the batch count.
- Write the conclusion, open actions and track them to closure.
Use validated spreadsheets or validated software for the calculations, and keep the raw data and formulas available for inspection. The quality unit reviews the trending data before approval.
What Do the Regulations Expect?
In the US, 21 CFR 211.180(e) requires written records so the data can be evaluated at least annually, to decide whether specifications or manufacturing and control procedures need changes. It also requires written procedures for this evaluation.
In the EU, Chapter 1 section 1.10 of EudraLex Volume 4 (2013 version) asks for regular periodic or rolling reviews to verify process consistency, check that specifications are still appropriate and highlight trends. Section 1.11 then says the results should be evaluated to decide whether corrective and preventive action or revalidation is needed. A revision of Chapter 1 has been under discussion, so check the current text.
Neither text sets a numeric Cpk target. Your site sets it. A process that is in a state of control and capable is also not the same as a validated process; Cpk does not replace validation or continued process verification (CPV).
Common Problems and Troubleshooting
Cpk looks good, but a batch is out of specification
Possible Causes: the Cpk came from few batches, an unstable period, or sigma taken from short-term variation.
Corrective Actions: recalculate with Ppk, add the lower confidence bound, and investigate the failed batch as an OOS.
Cpk is well below target
Possible Causes: the mean is off-centre, variation is wide, or two operators, lines or suppliers are mixed in one data set.
Corrective Actions: stratify the data, then open a CAPA. In practice, a shifted mean is more common than wide scatter, and it is easier to fix.
A trend sits inside specification
Possible Causes: slow drift in a raw material, equipment wear or method change.
Corrective Actions: treat it as an out-of-trend signal under your site-defined alert/action limit. See Out of Trend (OOT) results and alert limit vs action limit. Record the evaluation, then either open a CAPA or document why no action is needed.
Data changed mid-year
Possible Causes: a change that was approved through change control.
Corrective Actions: split the data at the change date and report both periods. Pooling them distorts limits and Cpk.
After any action, check effectiveness in the next review and link the result to the deviation, CAPA or change record.
Frequently Asked Questions
No. 21 CFR 211.180(e) and EU GMP section 1.10 require a review of trends and quality standards, but they do not name Cpk or a target value. Cpk is one accepted way to show capability. Define the method and the target in your site SOP.
Many sites use 1.33 as a minimum, and some use 1.67 or more for critical attributes. The FDA-hosted case study suggests Cpk above 1.33. These are company conventions, not regulatory limits. Set your value in the SOP with a written justification.
Yes. Check the control chart first. If run rules signal, investigate the cause or split the data, and explain this in the APR. Capability calculated on an unstable process describes a past that will not repeat.
No regulator gives a fixed number. More batches give a more reliable Cpk, and a figure from few batches is weak. Report the batch count with each result and calculate a lower confidence bound. Your SOP should state a minimum.
No. Cpk uses within-subgroup (short-term) sigma, while Ppk uses the overall sigma of all data. They give different results when batches shift. For a year of batches Ppk is usually more realistic. State which one you report.
Summary
Plot every batch in order, pick the right chart, and check stability first. Then calculate Cpk or Ppk, report the batch count, and keep control limits and specification limits apart. Fix the rules in the SOP before you see the data, and finish with a clear conclusion and tracked actions.
References
- EudraLex Volume 4, Chapter 1: Pharmaceutical Quality System (2013), European Commission
- Case Study: Use of Statistical Process Control to Detect Process Drift; Using Process Capability Measurement, L. Torbeck, US FDA
- 21 CFR 211.180, eCFR / US FDA
- Cpk vs Ppk, SPC for Excel
- Control Charts for Process Monitoring, MetricGate
- PIC/S PI 006-3, Validation Master Plan, IQ/OQ, Non-sterile process validation, Cleaning validation, PIC/S, 25 September 2007

Pankaj Sharma — Quality Control Specialist
Pankaj Sharma is a pharmaceutical QC professional who reviews our technical content for GMP accuracy, laboratory practices, and regulatory relevance.